

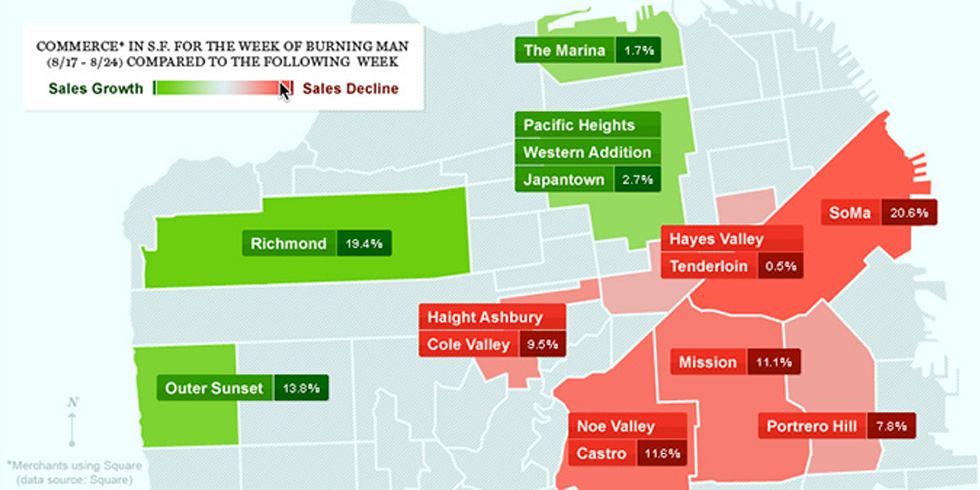
Fortune magazine tracked which neighborhoods in San Francisco went to Burning Man using data harvested from Square. The map above shows percentages of how much business these areas gained (in green) and lost (in red) during Burning Man. Not surprising: Most commerce was lost in SOMA. As Richmond SF Blog points out, “That’s where a lot of tech workers typically spend, and a lot of them make a mass exodus to Burning Man. When they leave town, so does their $$.” Aside from the tech folks, though, SOMA is home to the How Weird Street Fair and has always had a Burner contingent. Other parts of the city where business was negatively affected were the Mission, Noe Valley/Castro, Haight Ashbury/Cole Valley, and Potrero Hill. Hayes Valley/Tenderloin only had a tiny decrease in sales — 0.5%.
On the other hand, other parts of the city were positively affected by a Burner-free SF. Businesses in the Richmond and Outer Sunset in particular were feeling the love from our wallets, which according to Fortune, means that there are less Burning Man enthusiasts who live out in the avenues and possibly a lot more Labor Day sales that were drawing people to shop there.
[H/t: Richmond SF Blog; image via Fortune/Square]
The Bold Italic is a not-for-profit media organization, and we publish first-person perspectives about San Francisco and the Bay Area. We operate under a fiscal sponsorship of a 501(c)(3).
You can become a paid subscriber. Or donate. Or learn more about us.