Background image: The Bold Italic Background image: The Bold Italic
Social Icons

NASA Maps Show California’s Lighting Complex Fires

8 min read
J. Bradley Chen
Animated gif showing red areas (representing fires) growing and spreading near the coast south of San Jose.
August 16–21, 2020. Credit: NASA FIRMS. More info below.

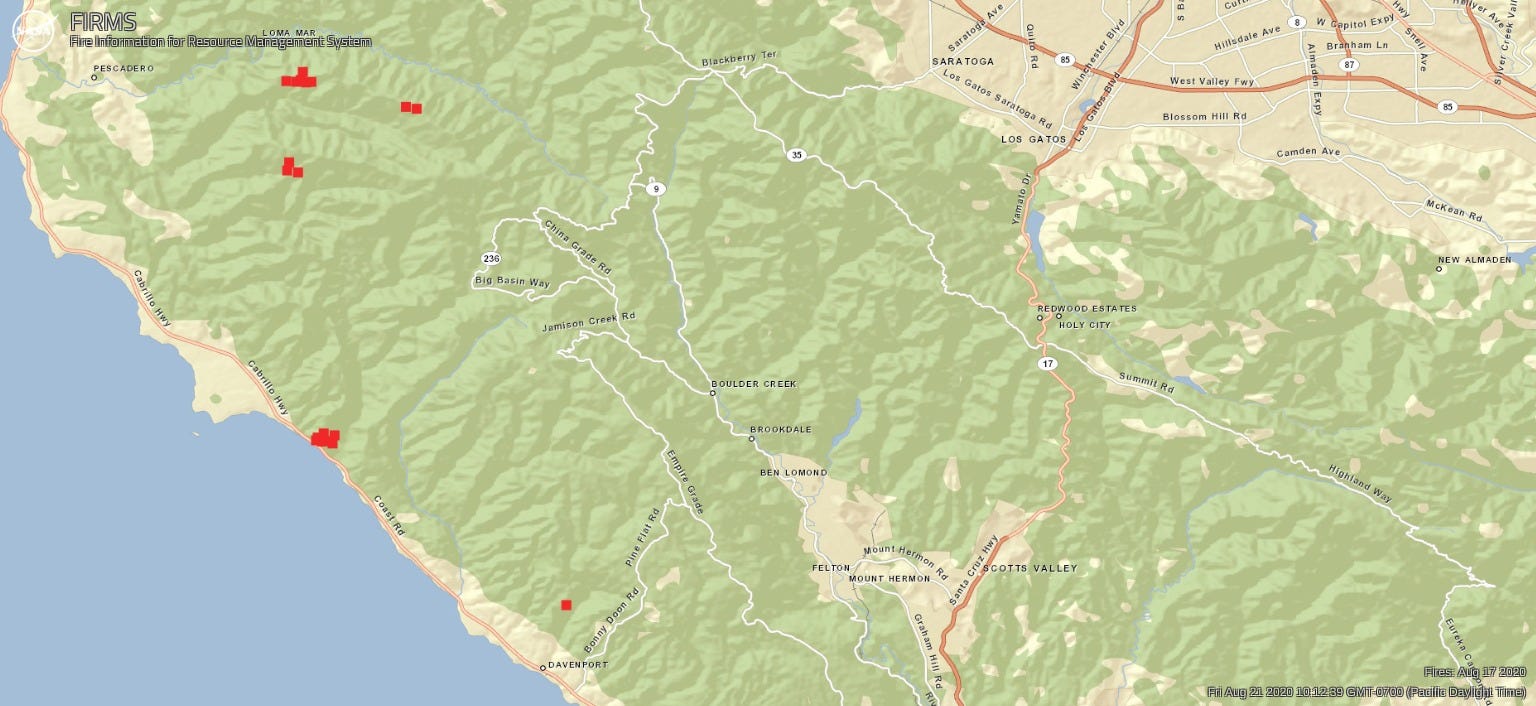
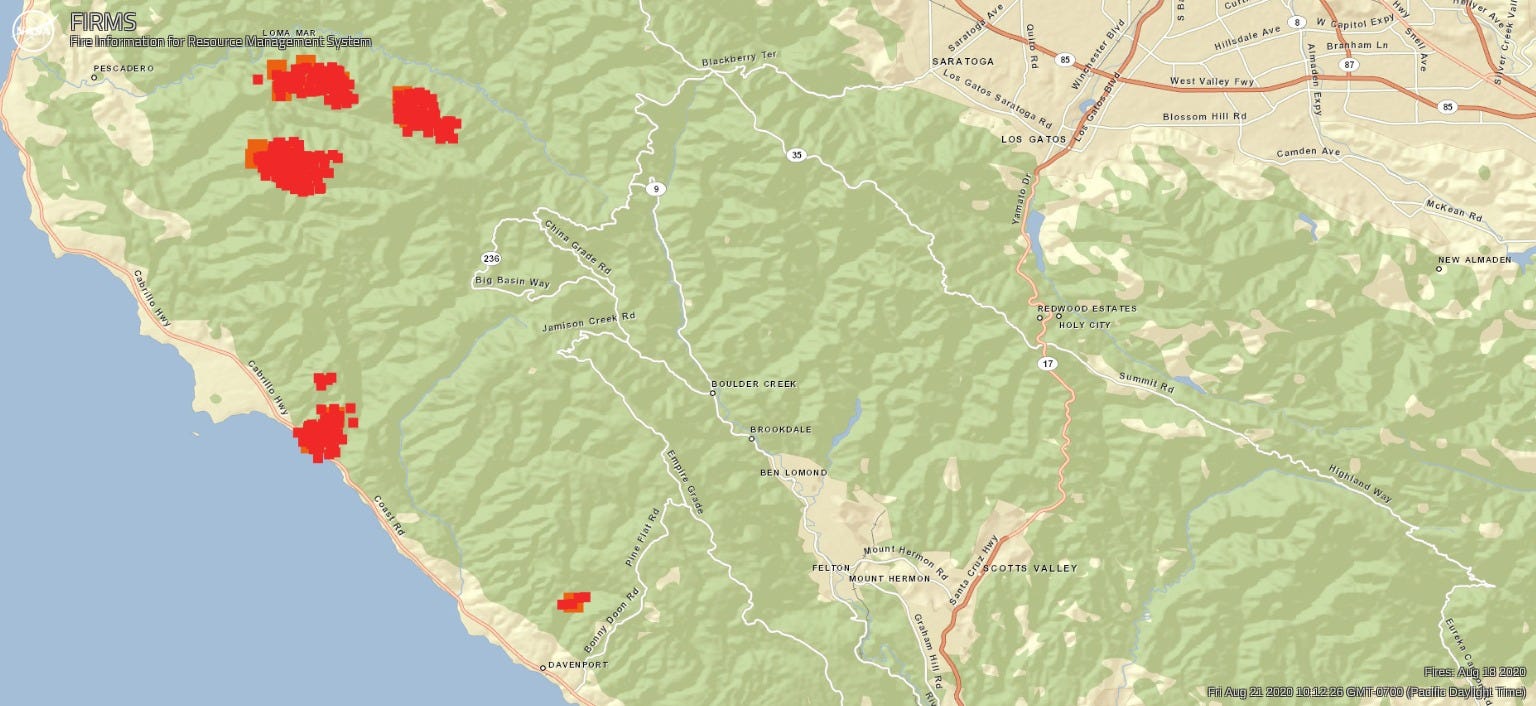
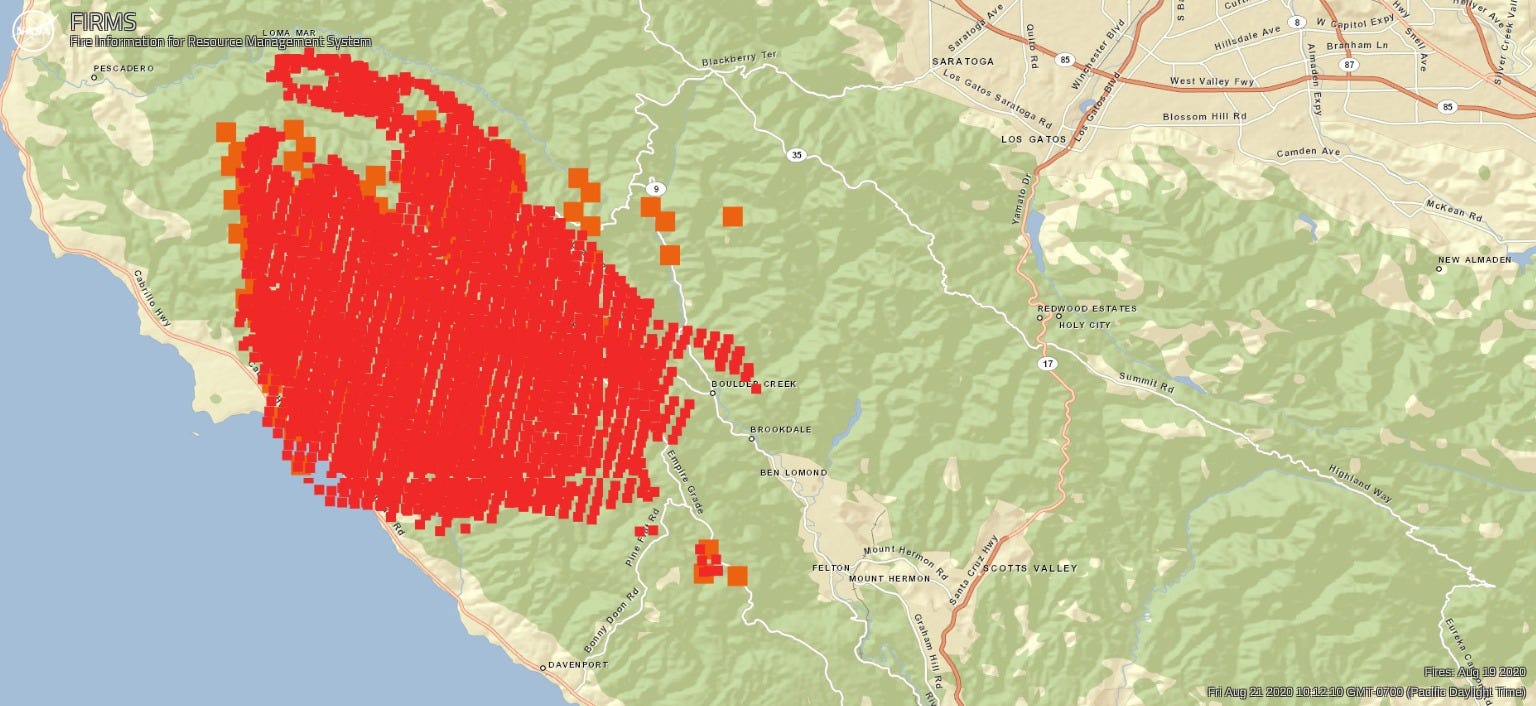
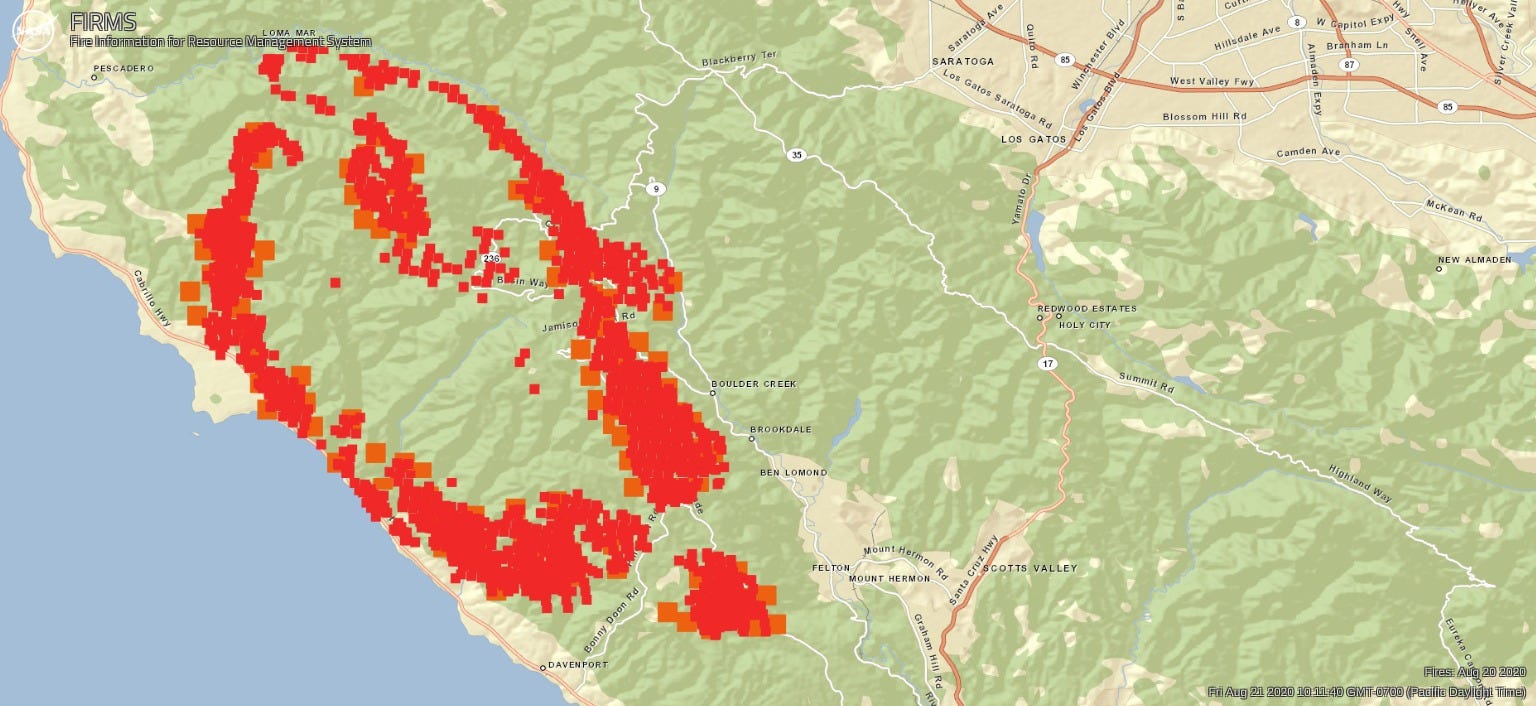
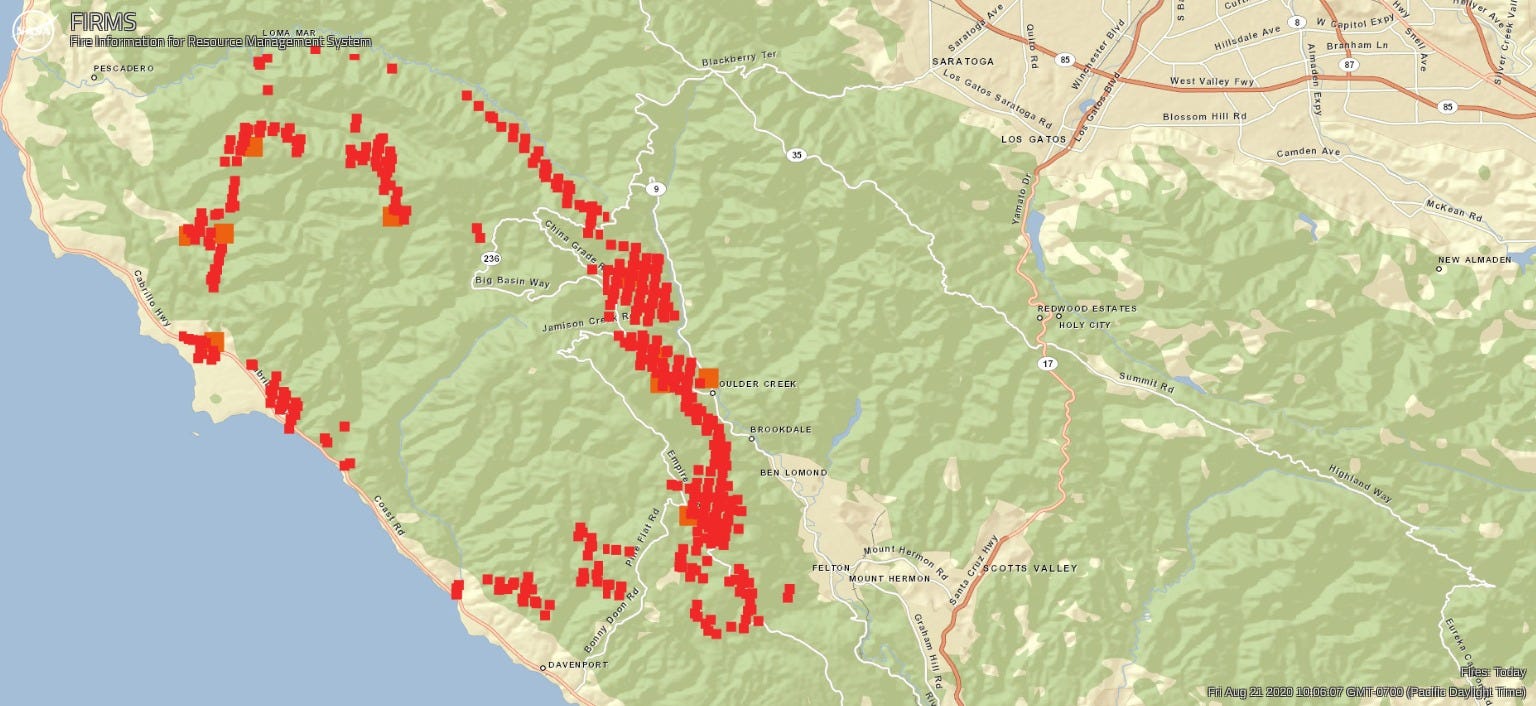
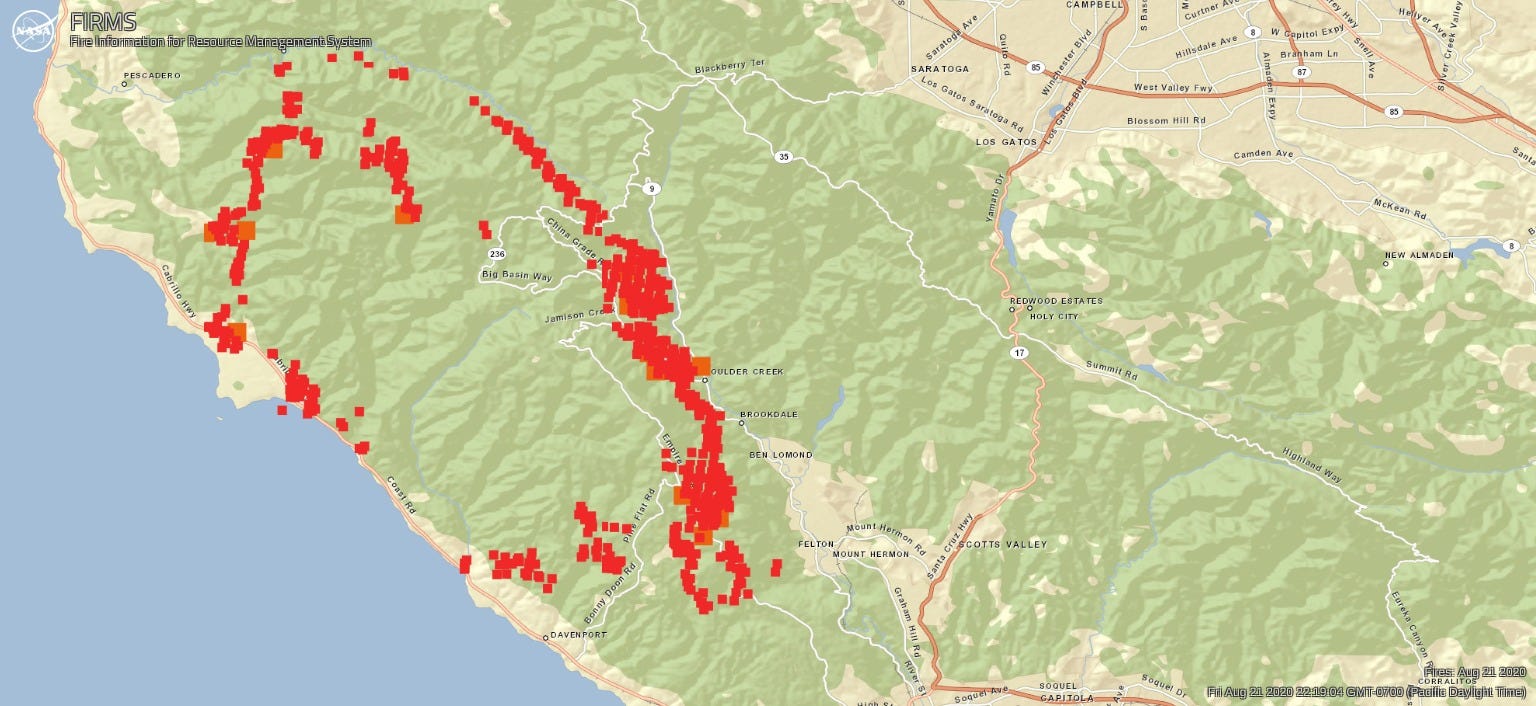
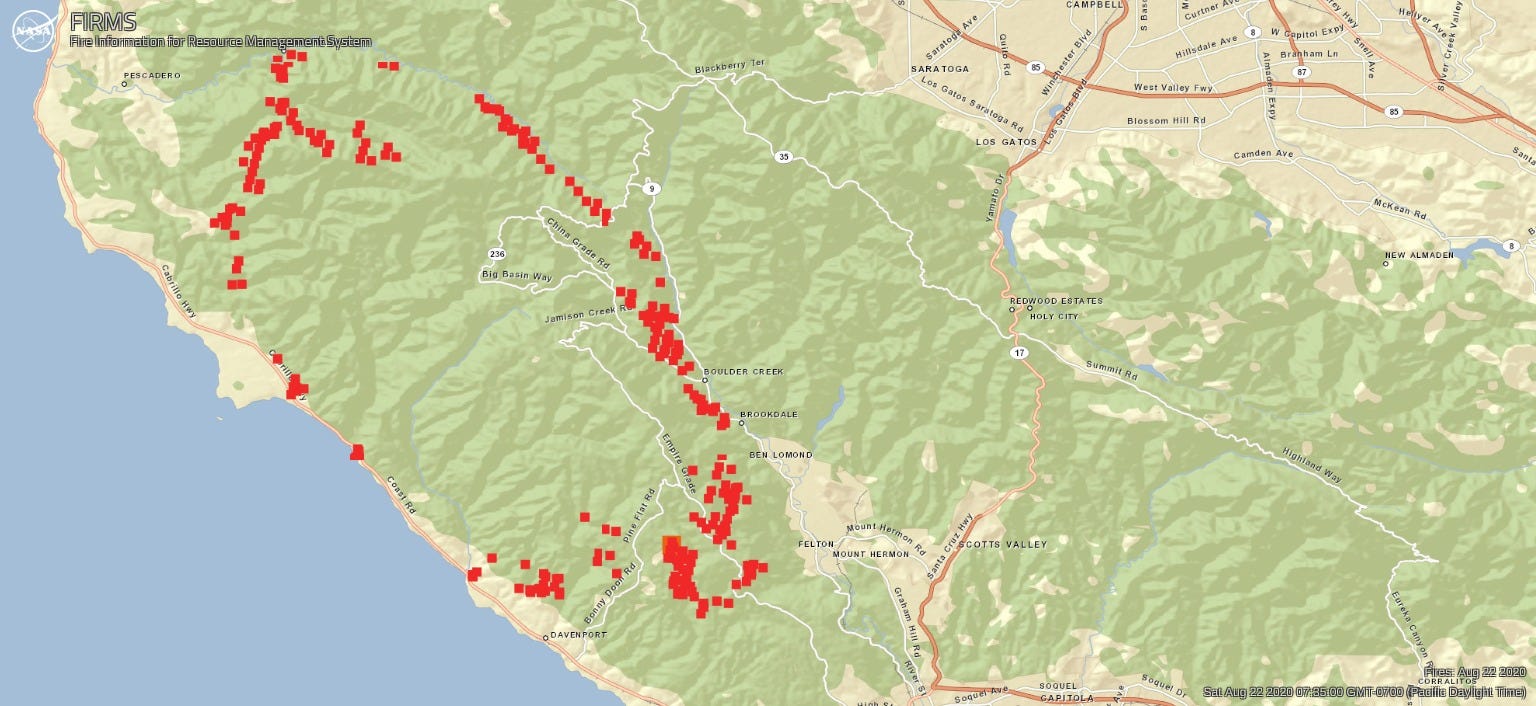
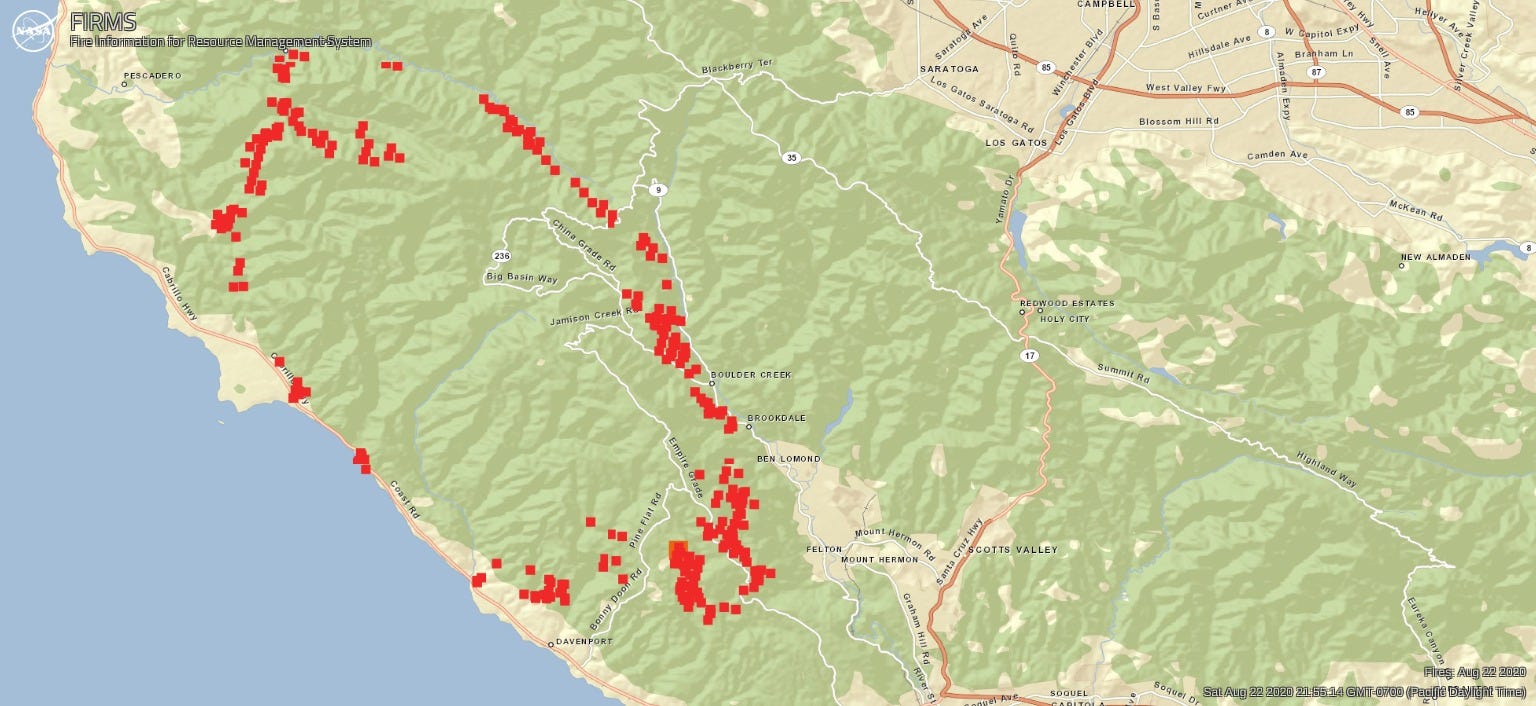
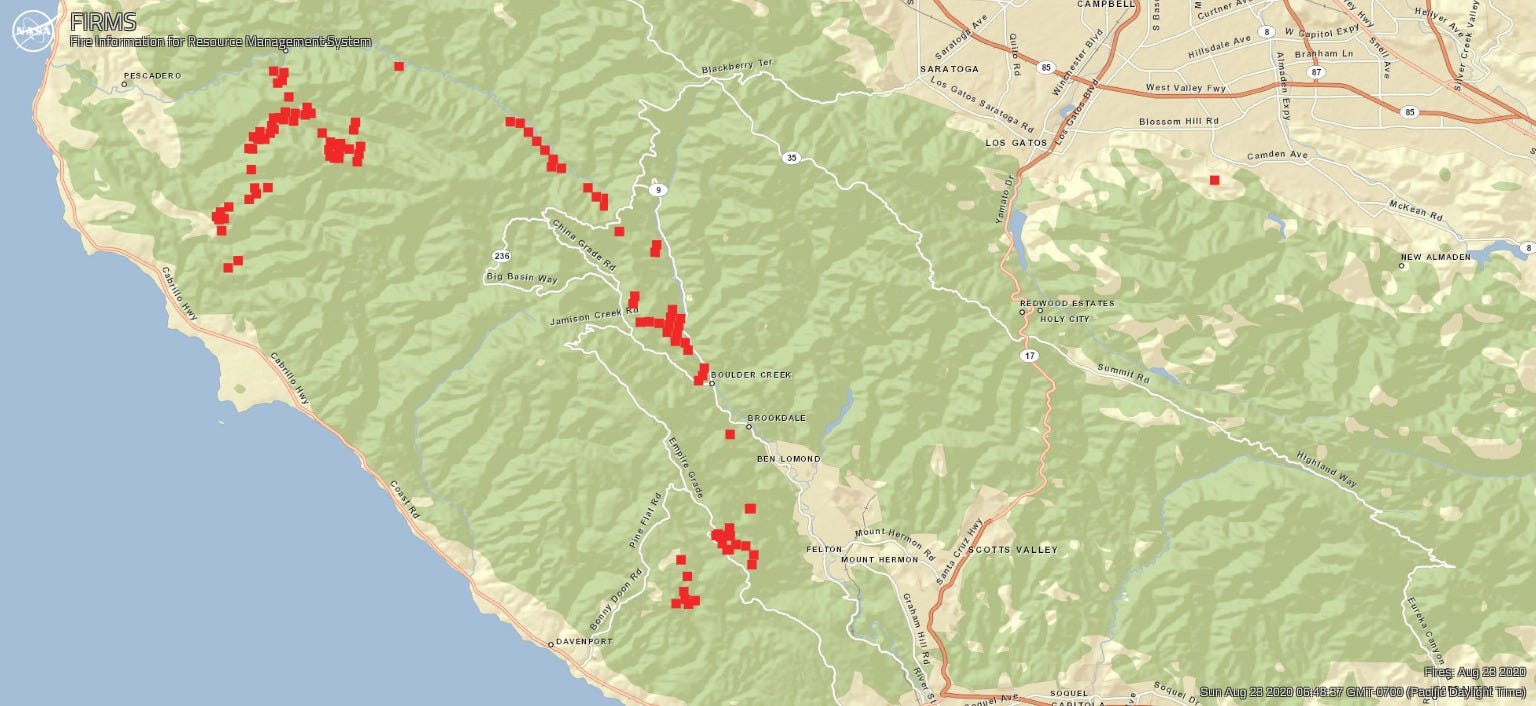
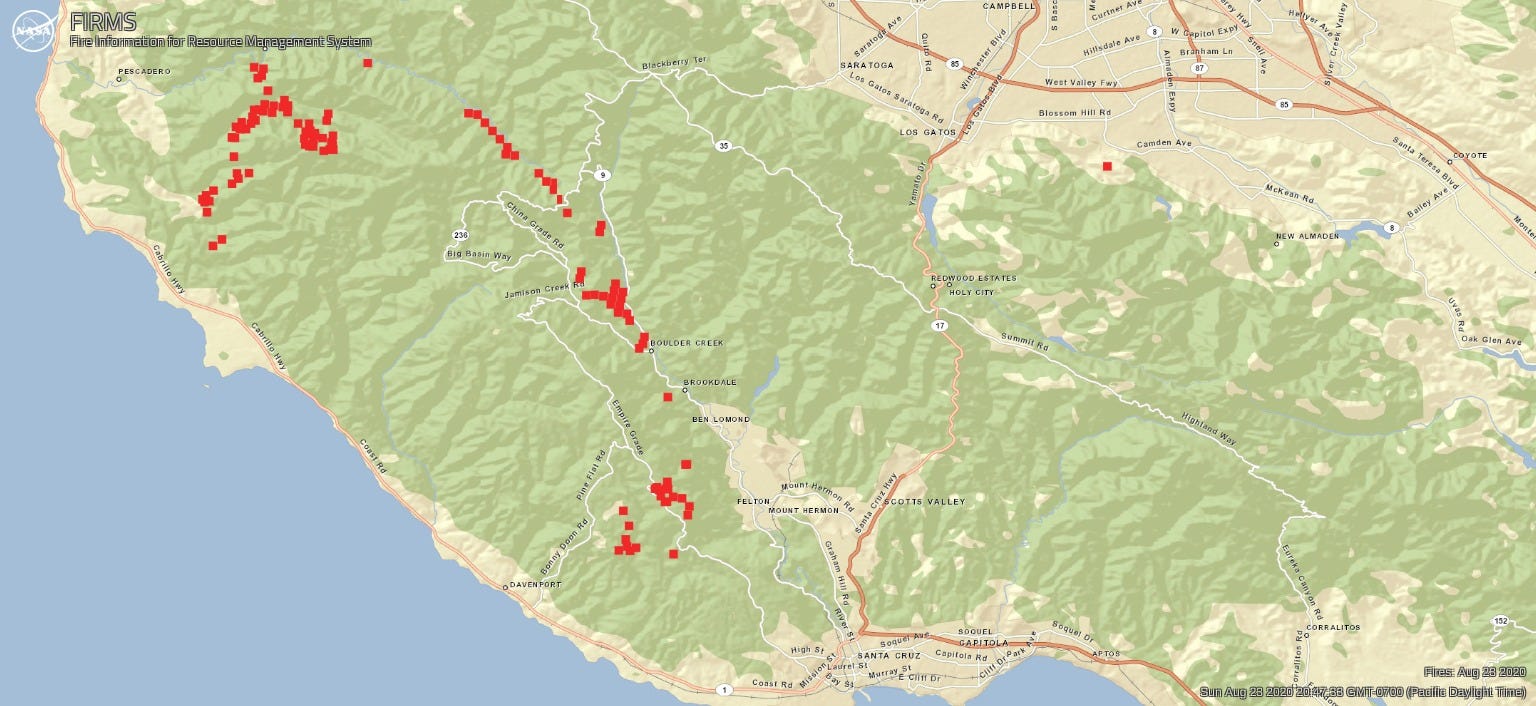
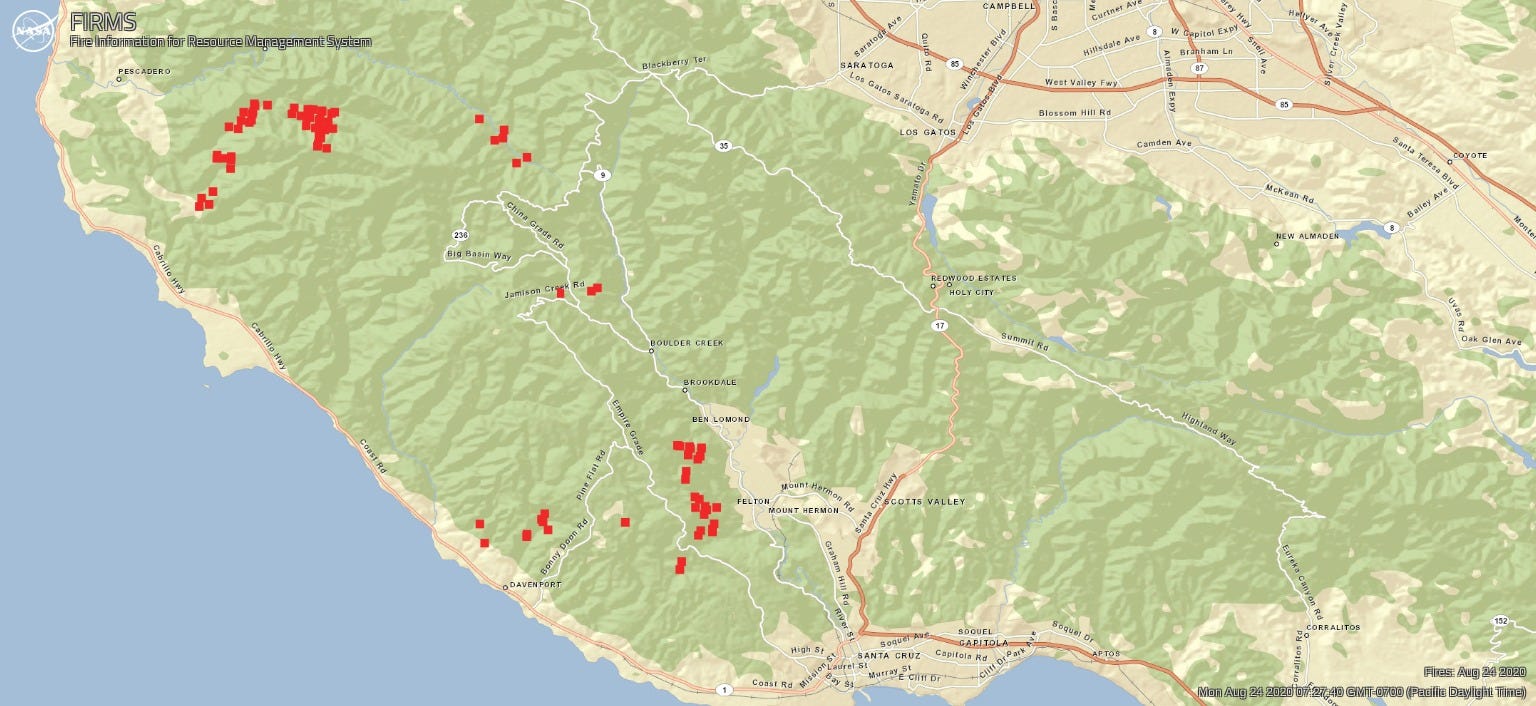
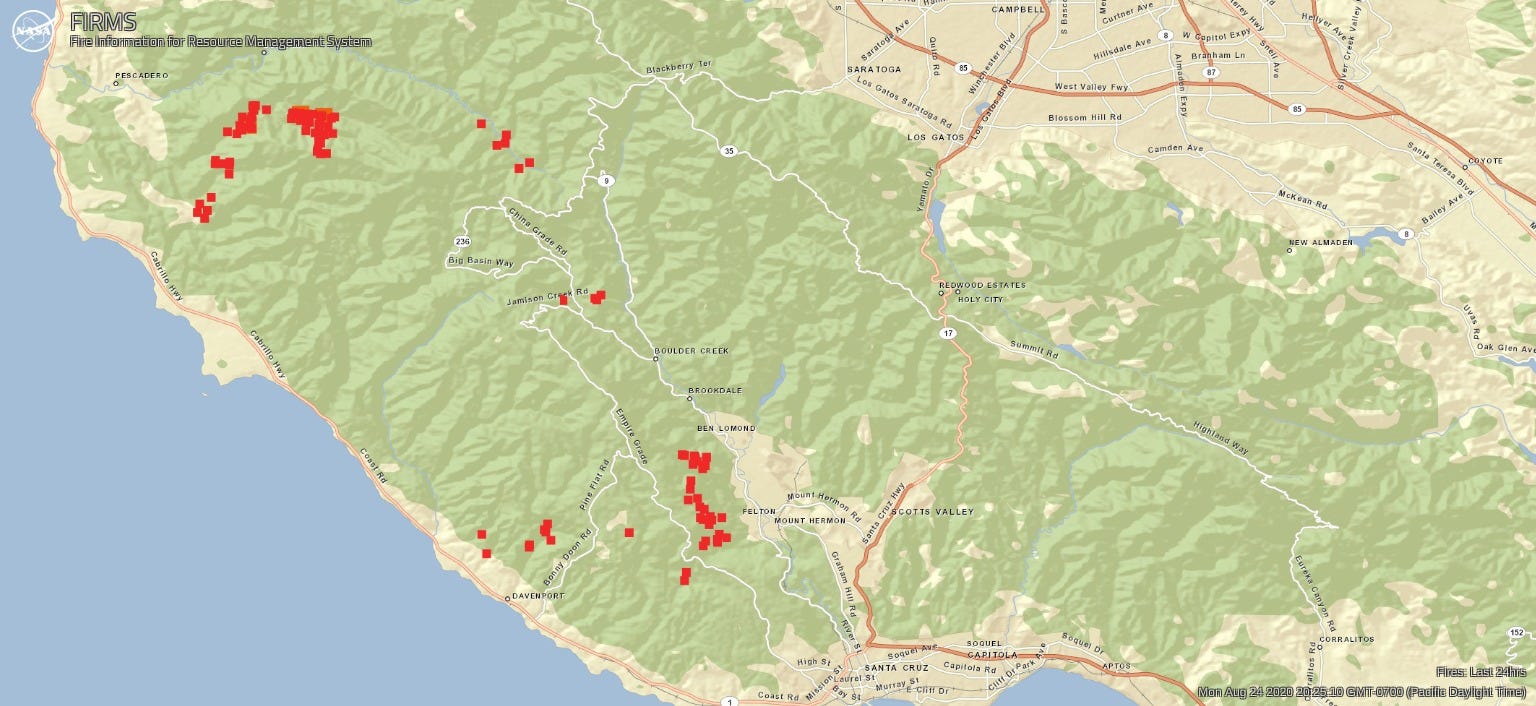
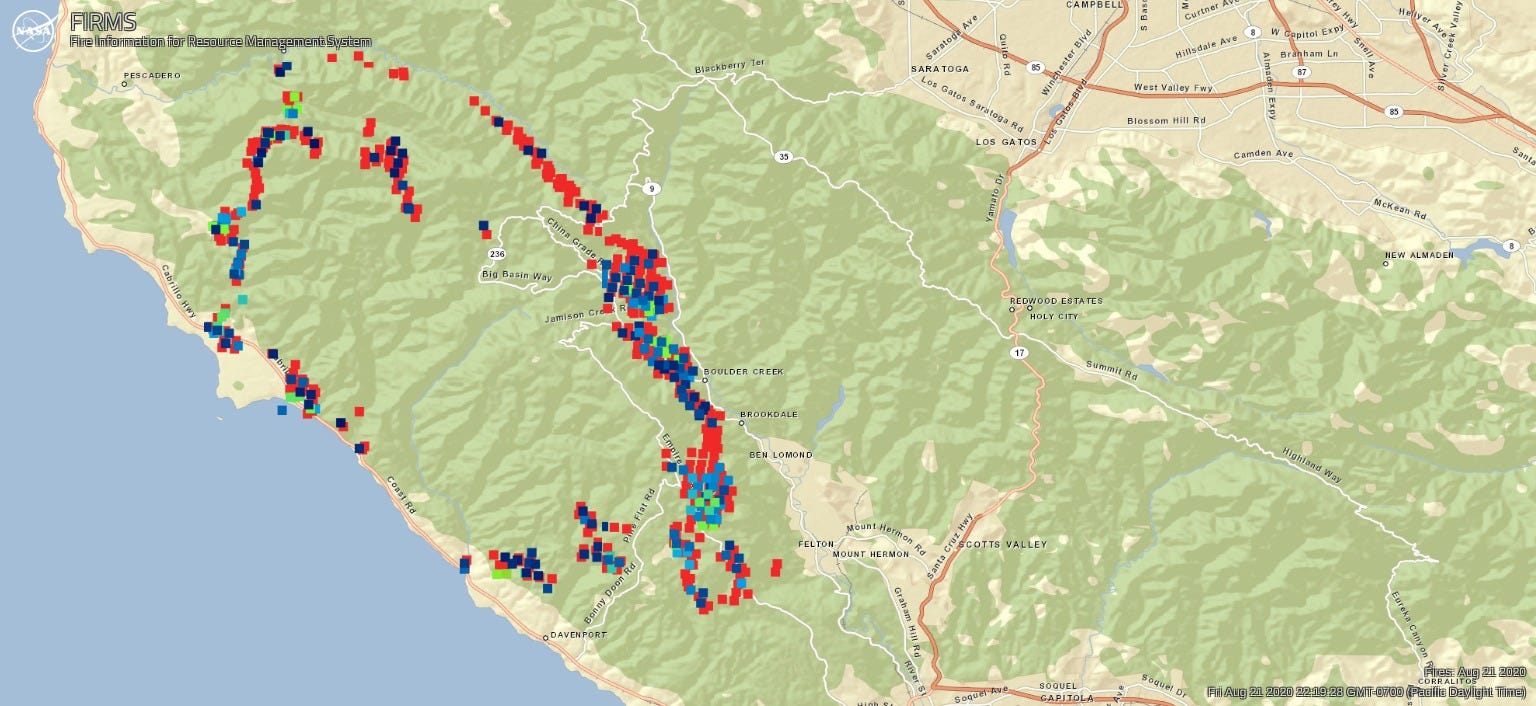
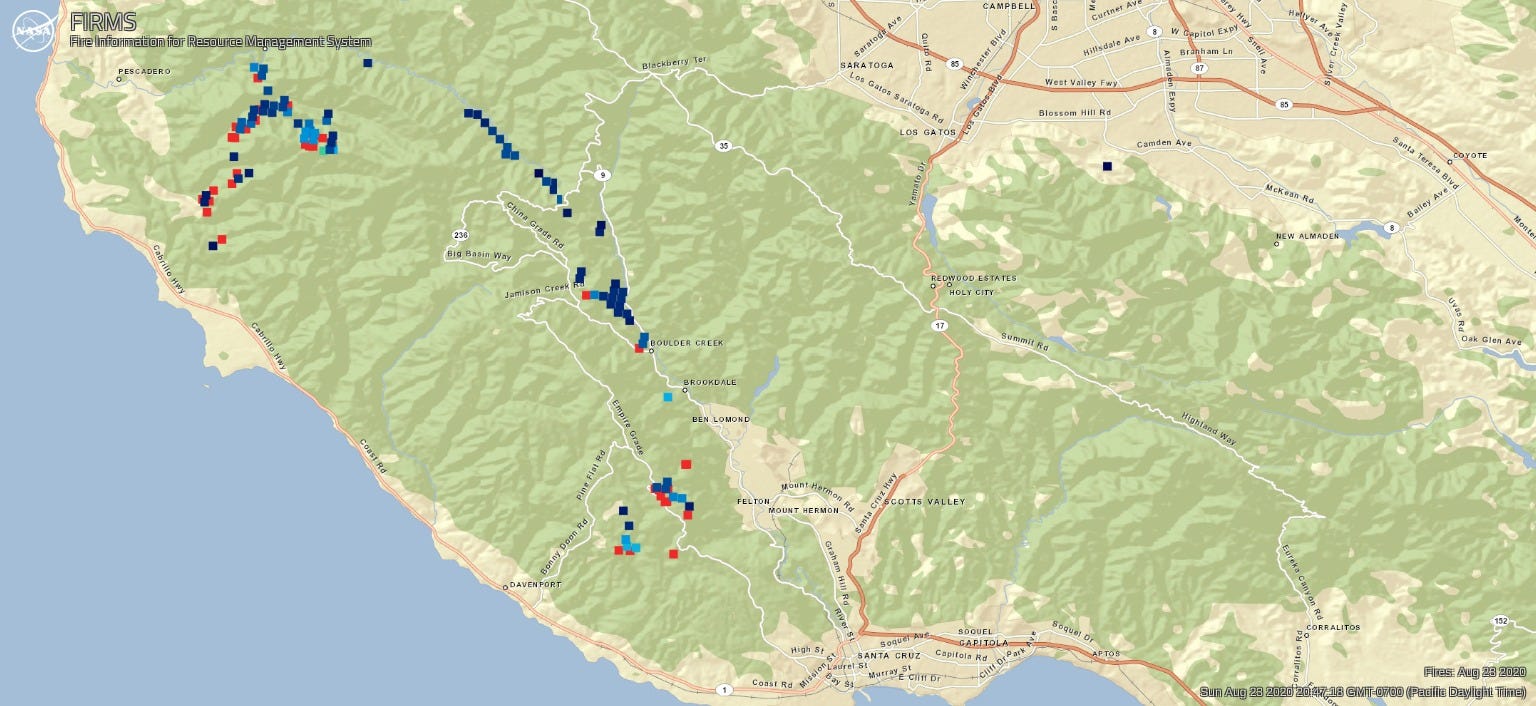
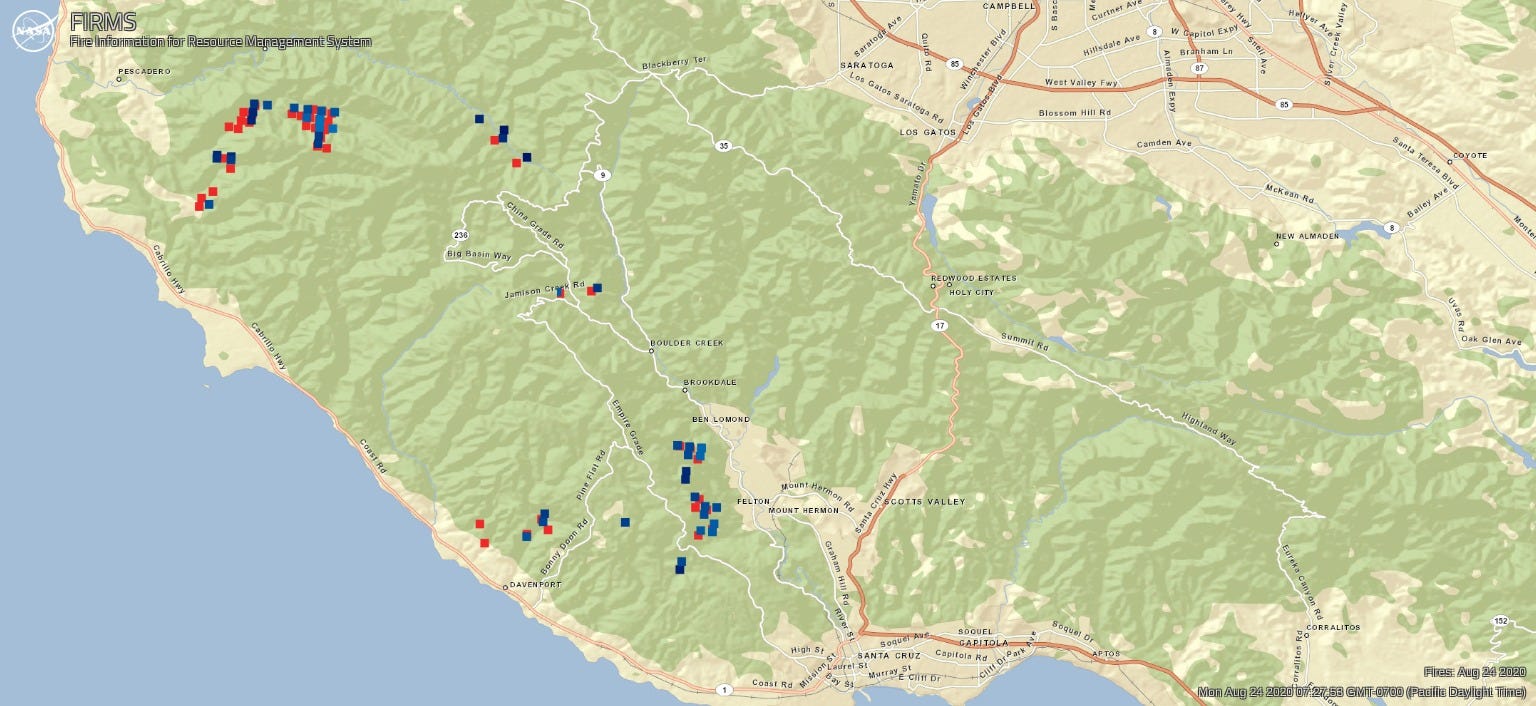
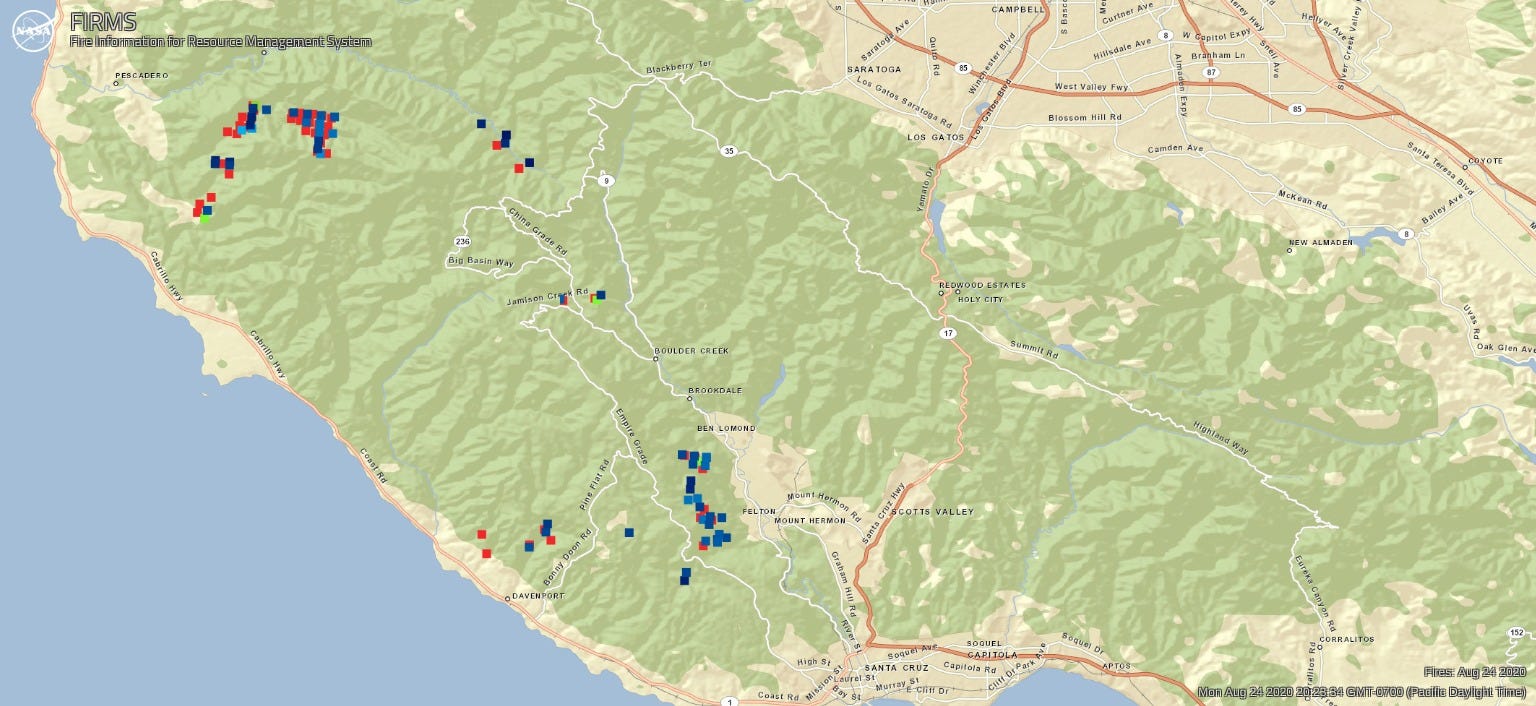
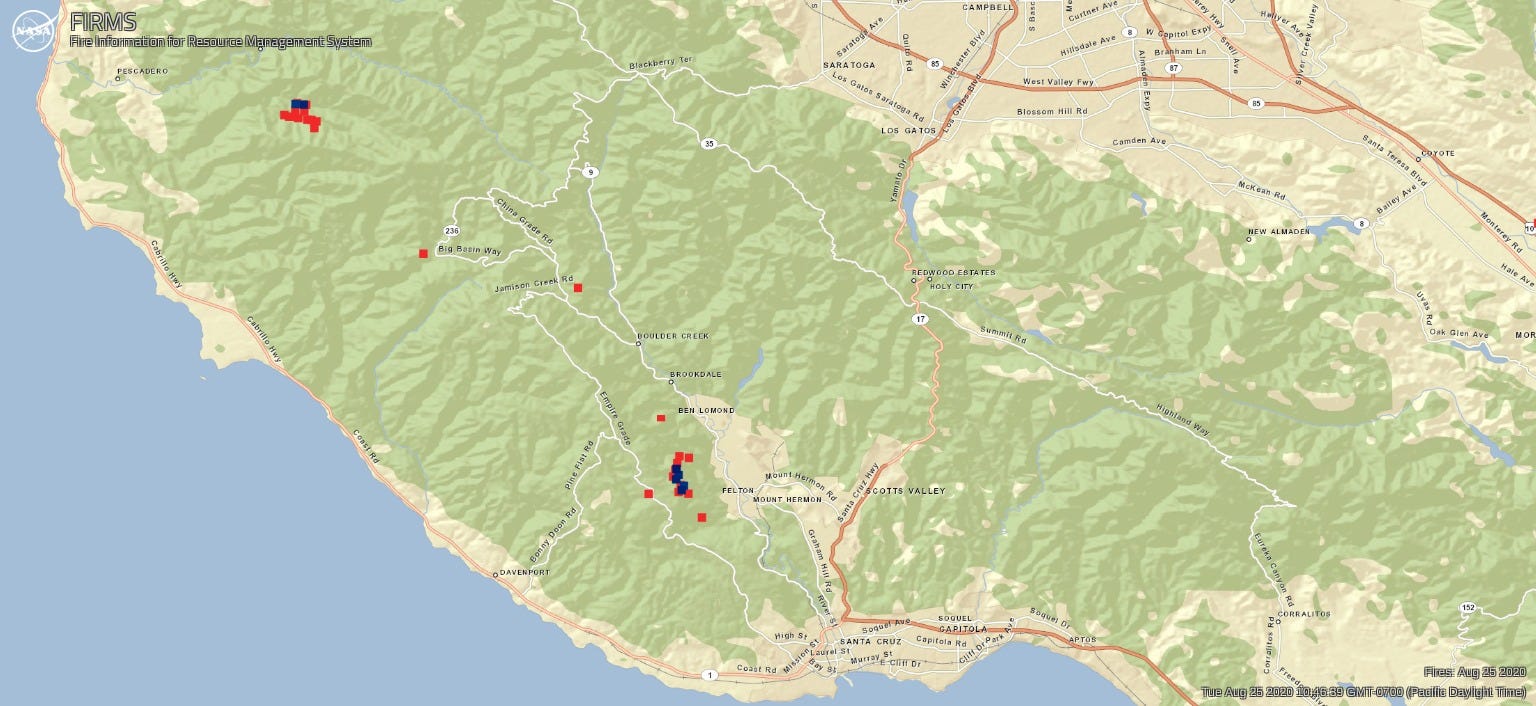
As dozens of fires continue to blaze across Northern California, I’m grateful for helpful maps and materials posted to Twitter and 95033talk to give insight into where the flames are heading. But I wanted more detailed maps, so I’m sharing this map series of the CZU Lightning Complex Fires generated using NASA FIRMS, which is operated by the NASA/Goddard Space Flight Center Earth Science Data and Information System (ESDIS) project.

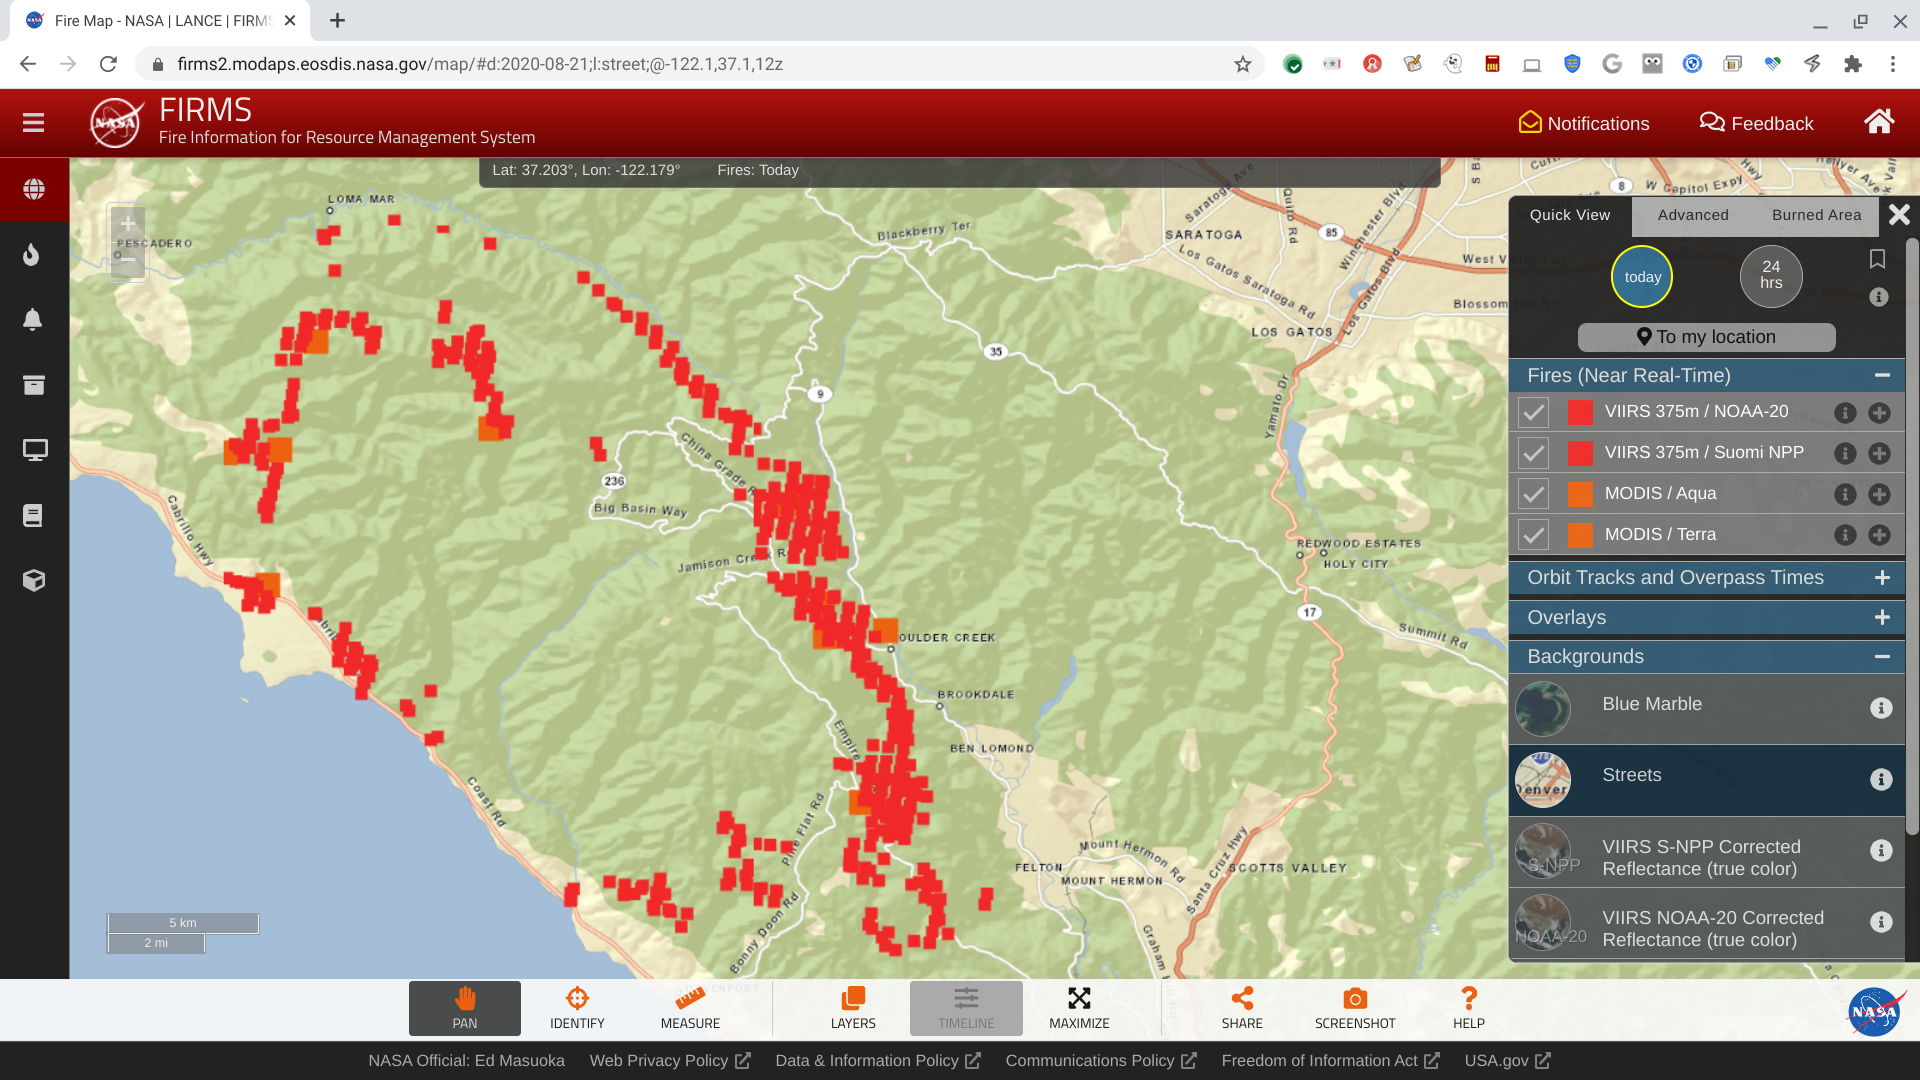
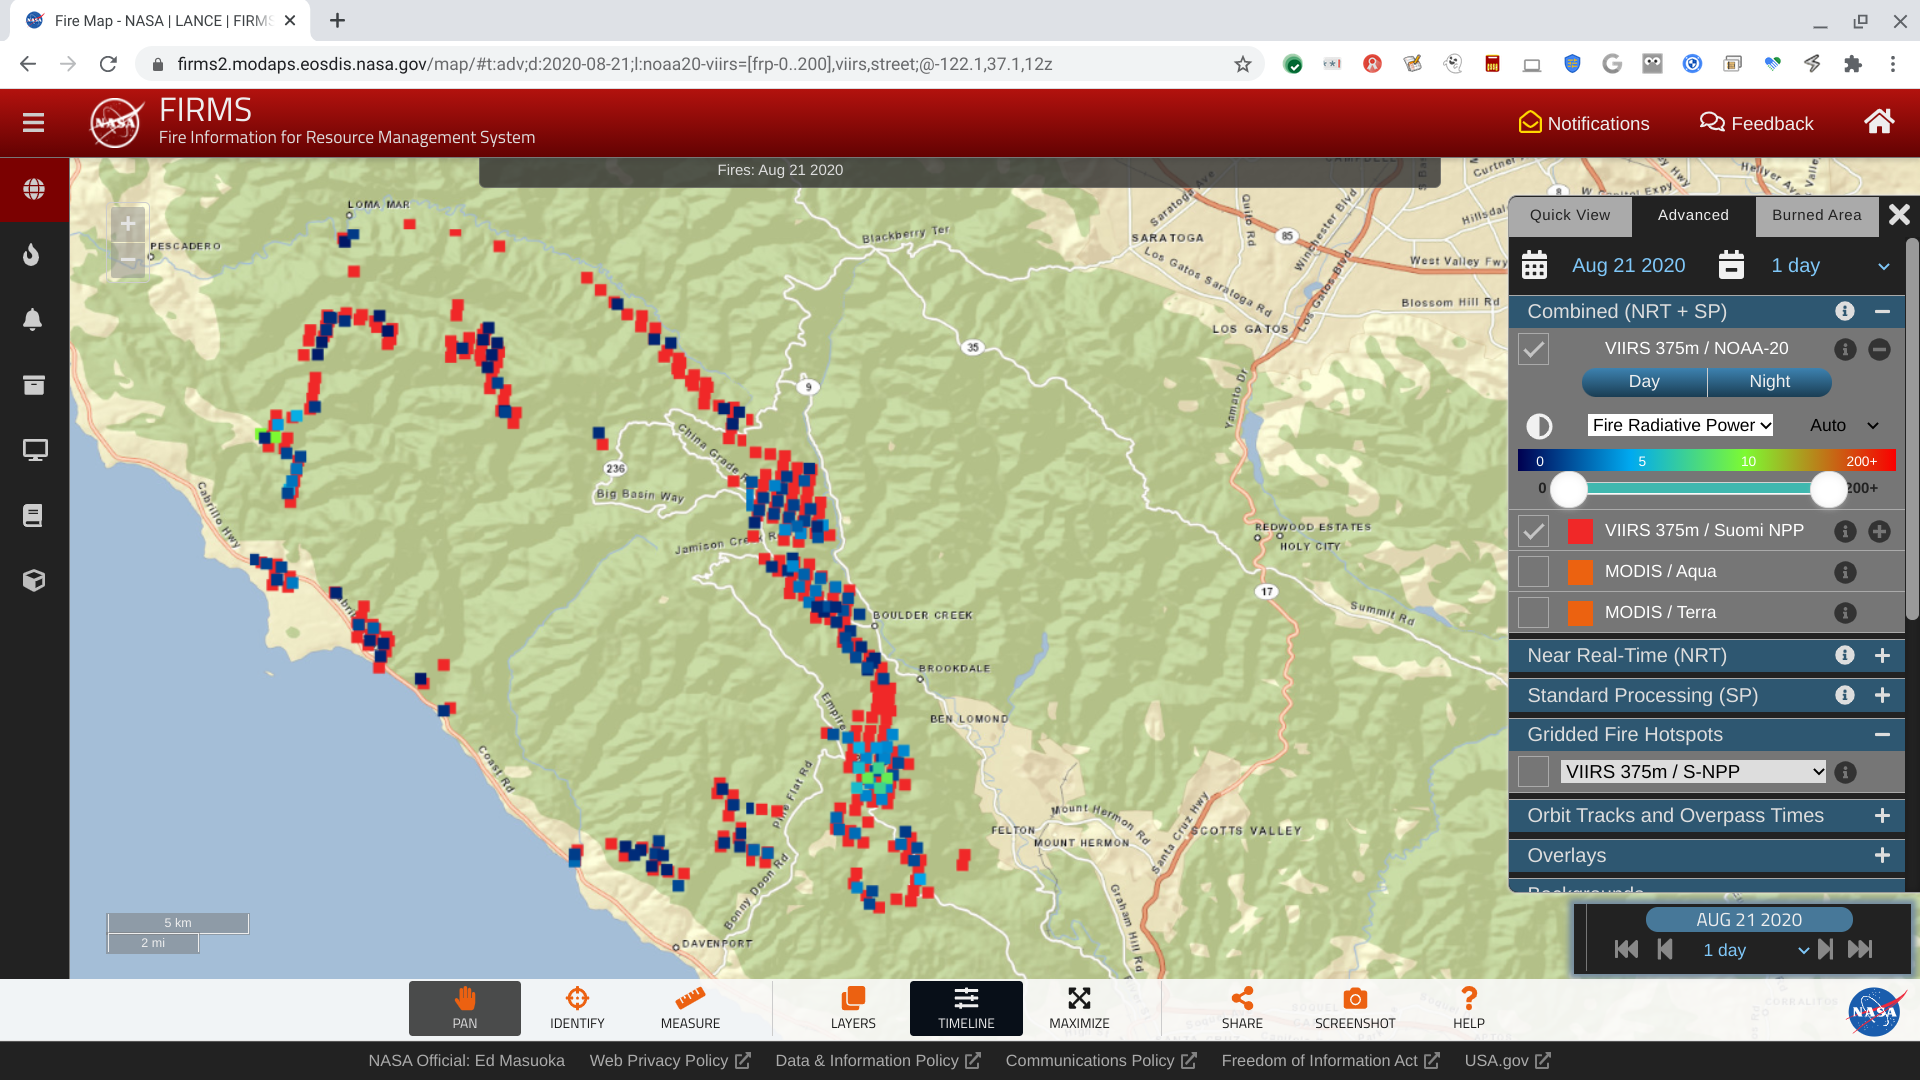
The FIRMS Fire Maps allows you to interactively browse the full archive of global active fire detections from MODIS and VIIRS satellite systems. Near real-time fire data are available within approximately three hours of satellite overpass with imagery in 4–5 hours.

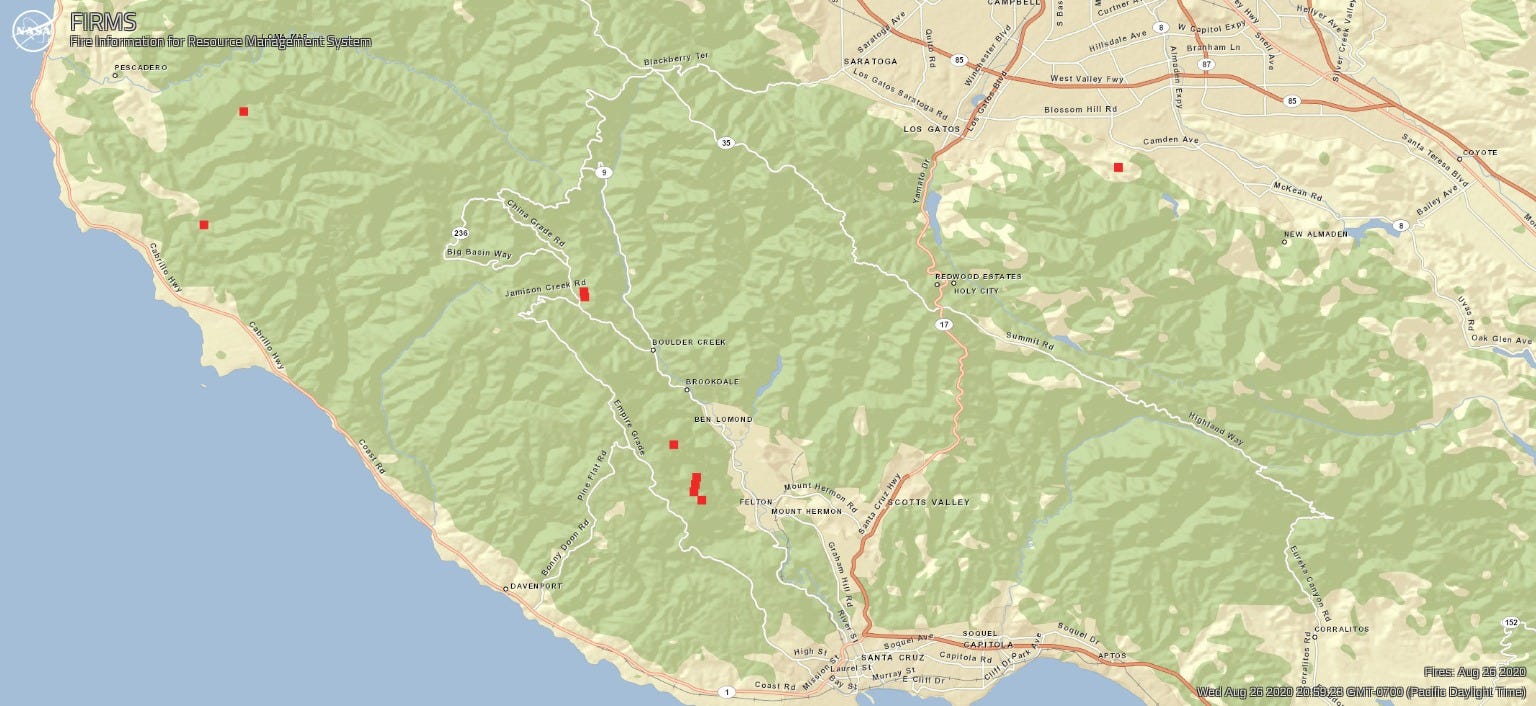
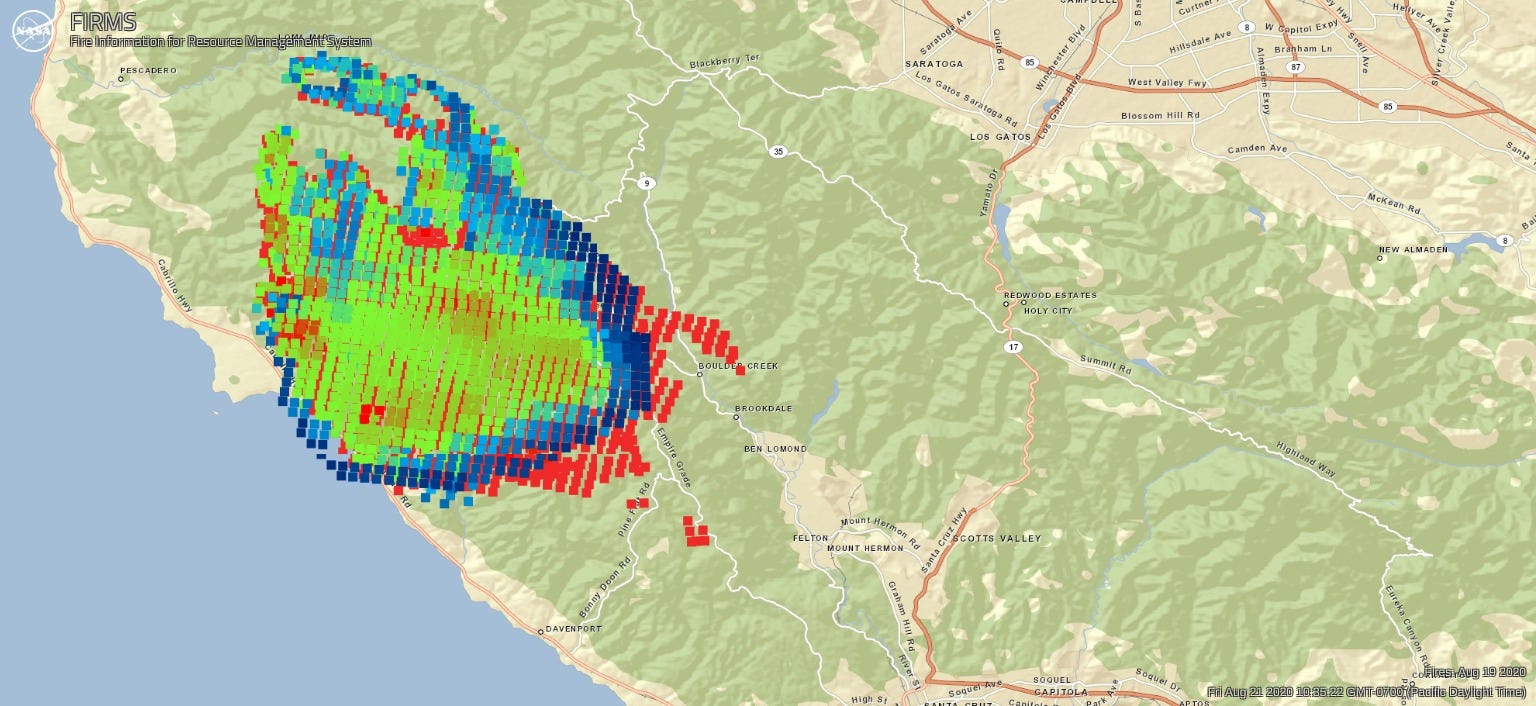
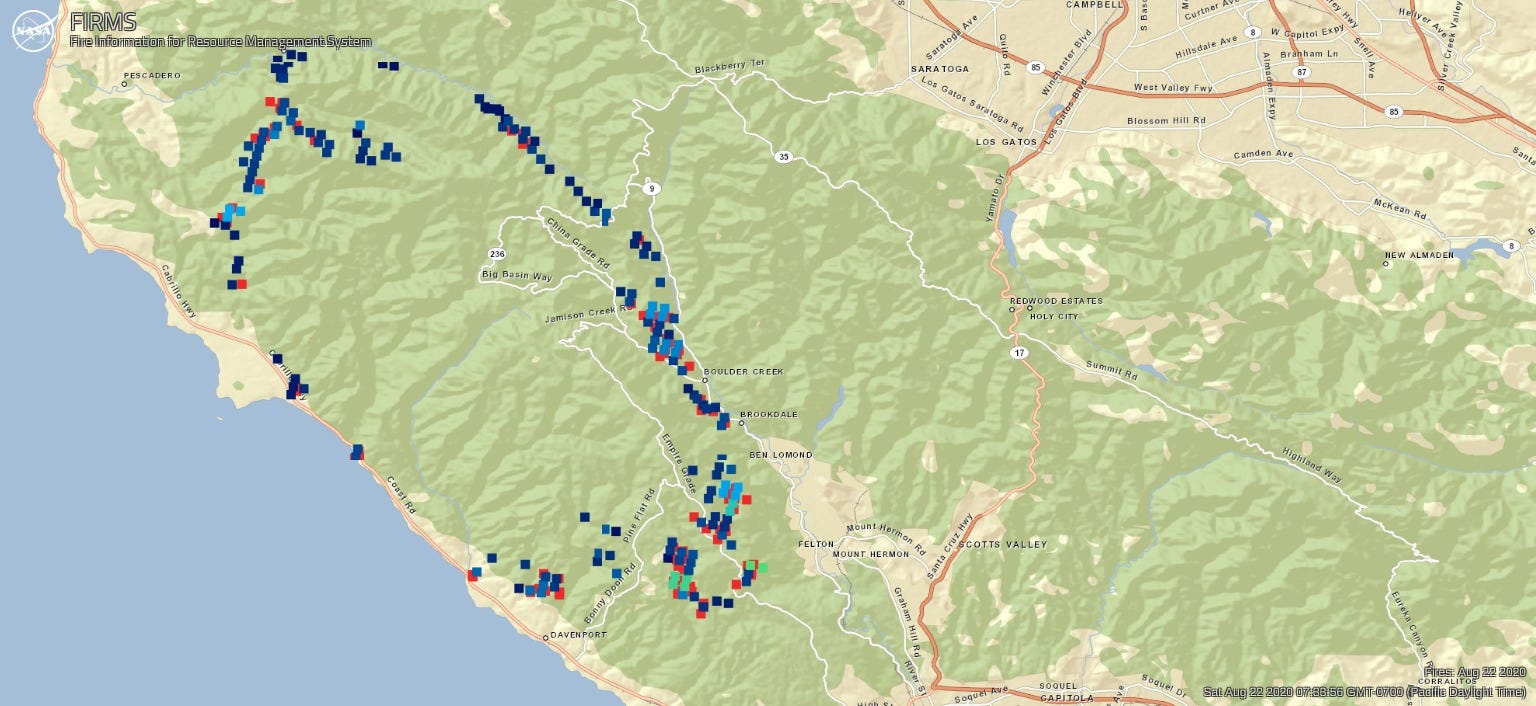
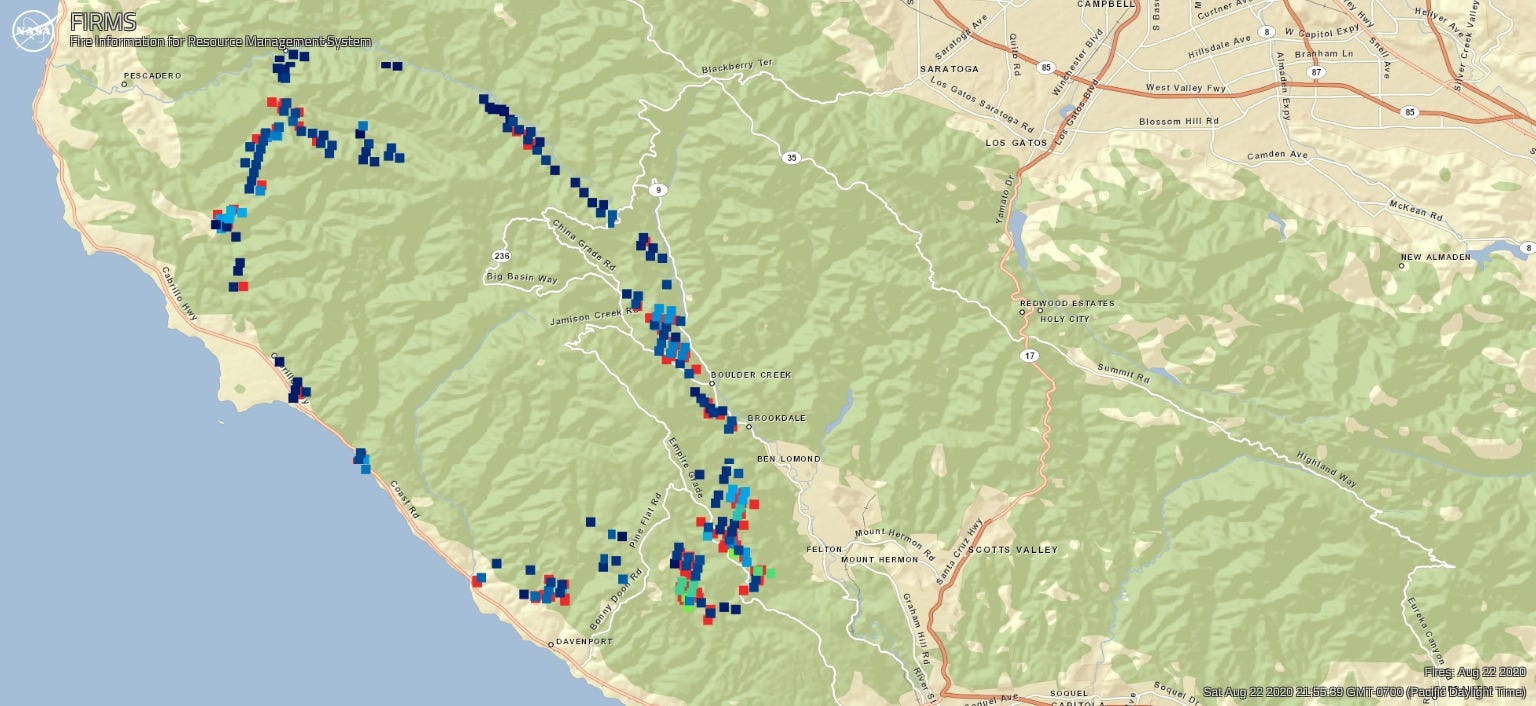
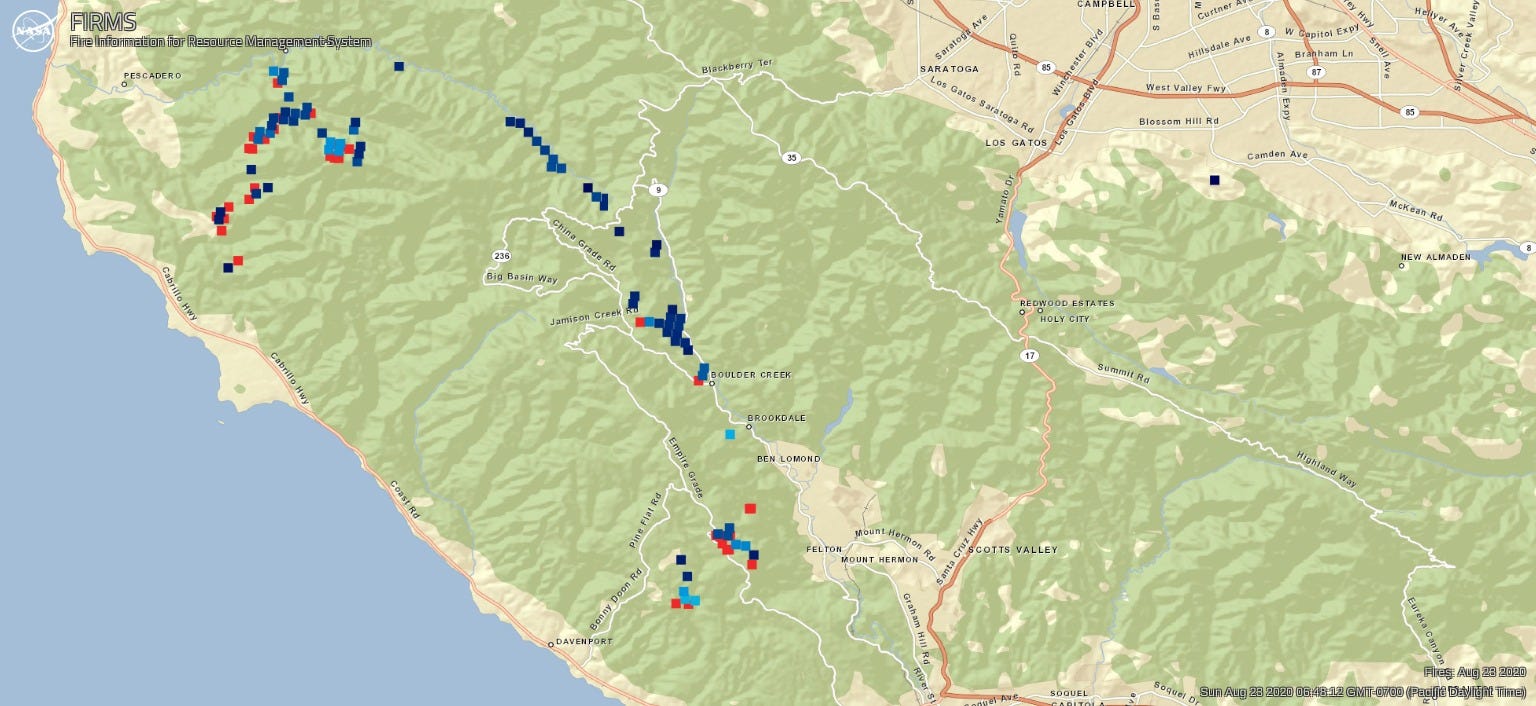
The maps suggest notable cooling since 19 August. See this post for estimates of the area and power of these fires based on NASA FIRMS satellite data.

Area and Power Estimates of the California Lightning Complex FiresEstimating the area and power of the #CZULightningComplex and #SCULightningComplex fires from satellite data.medium.com

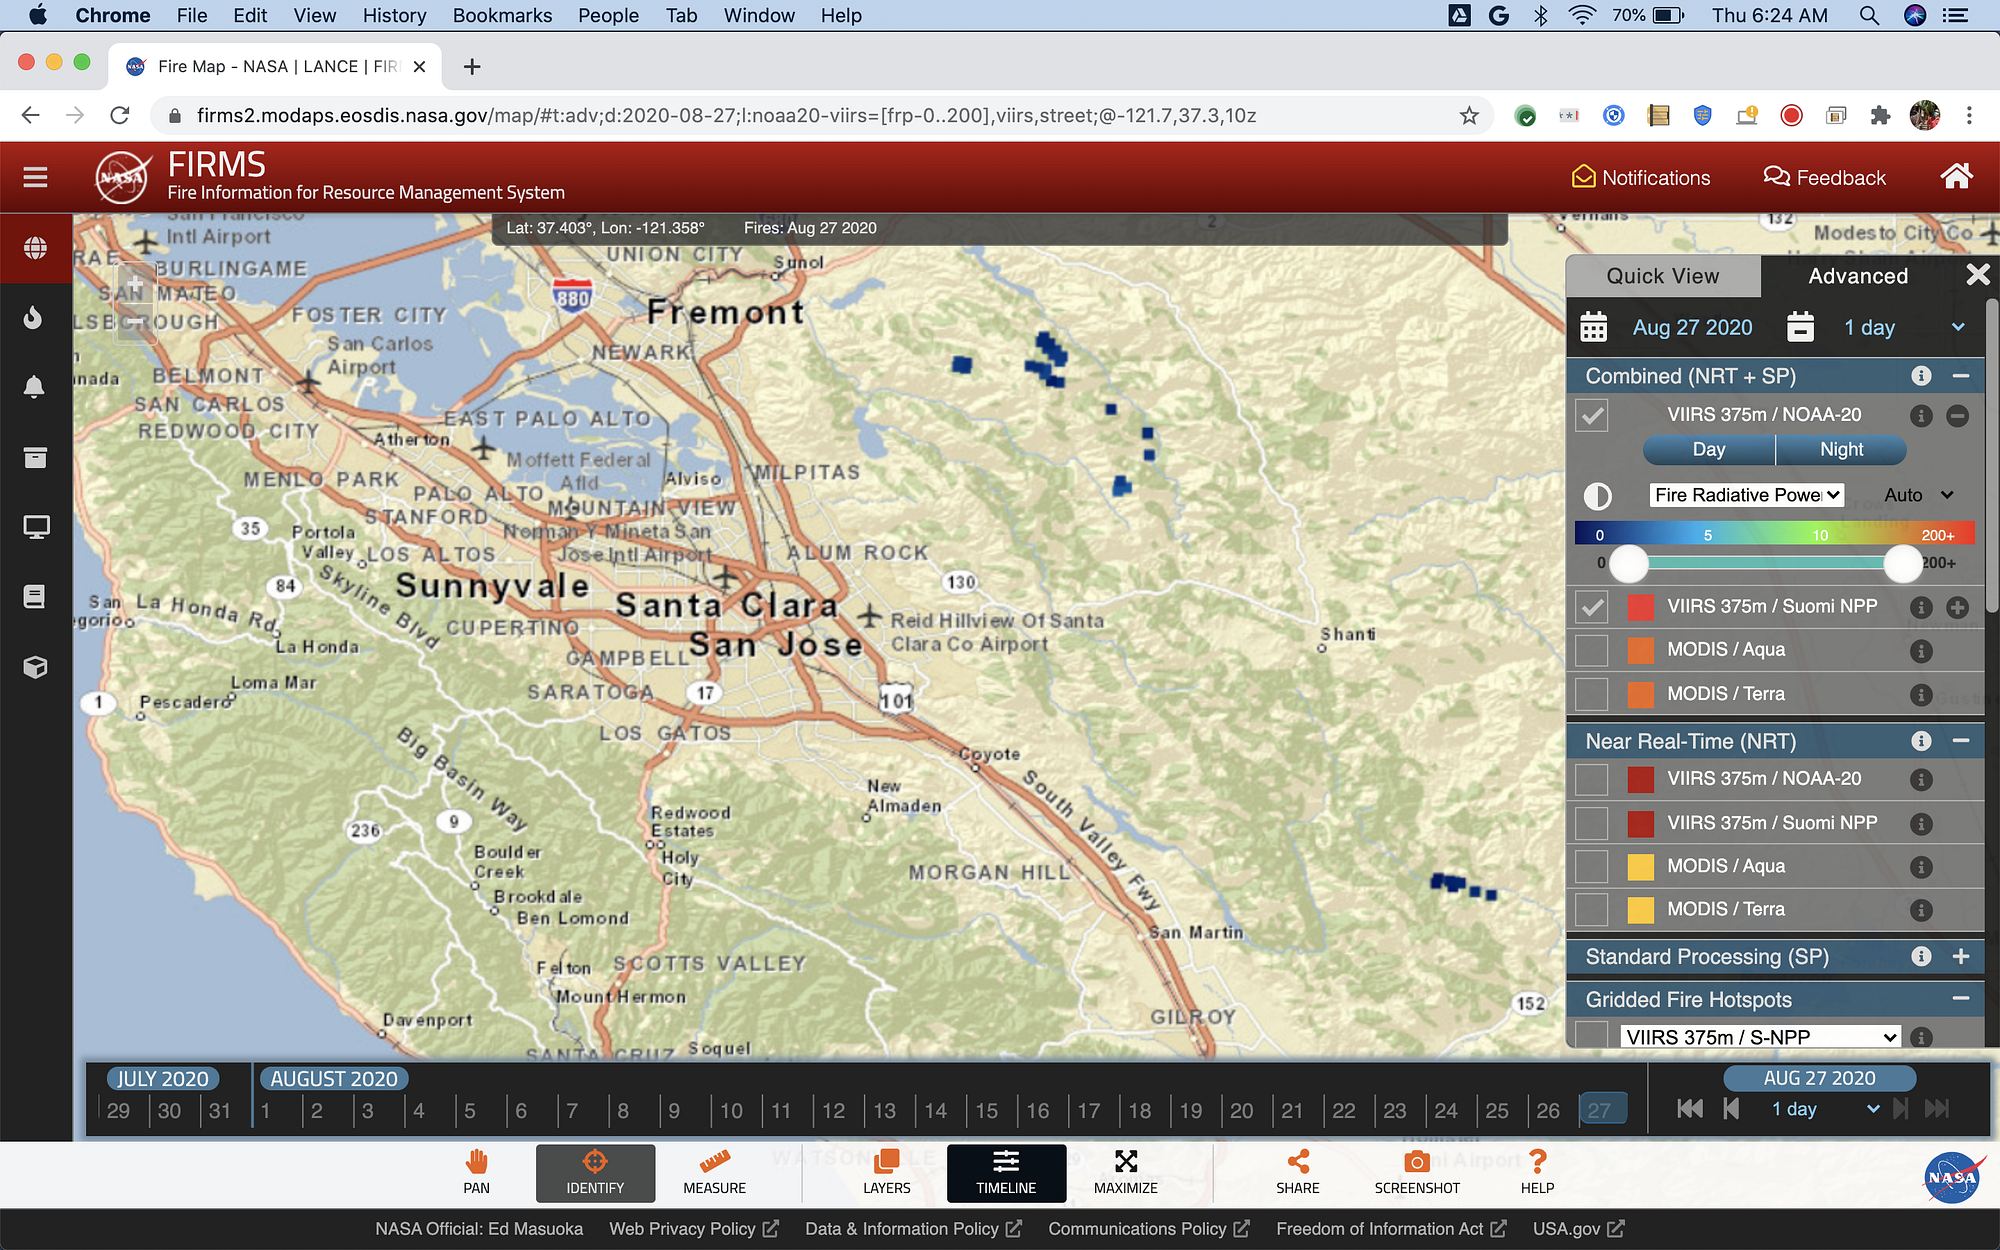
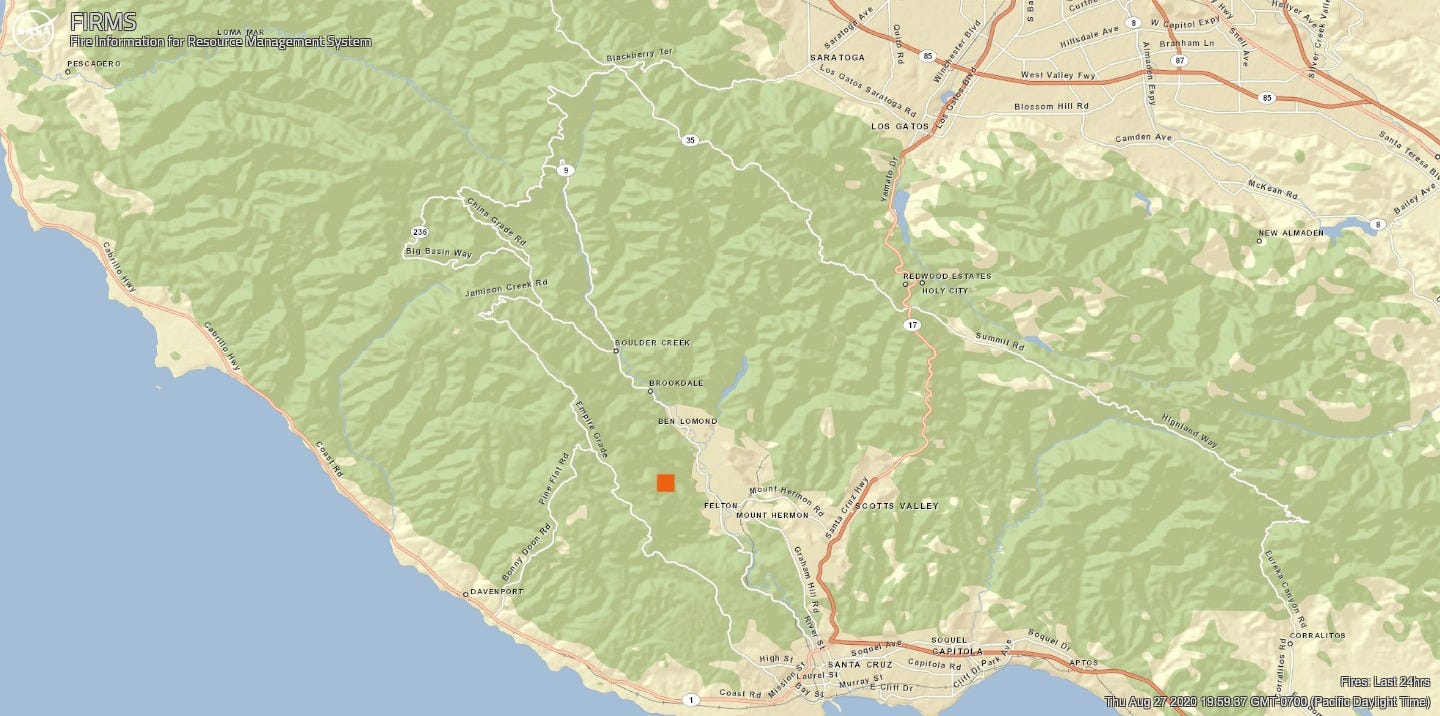
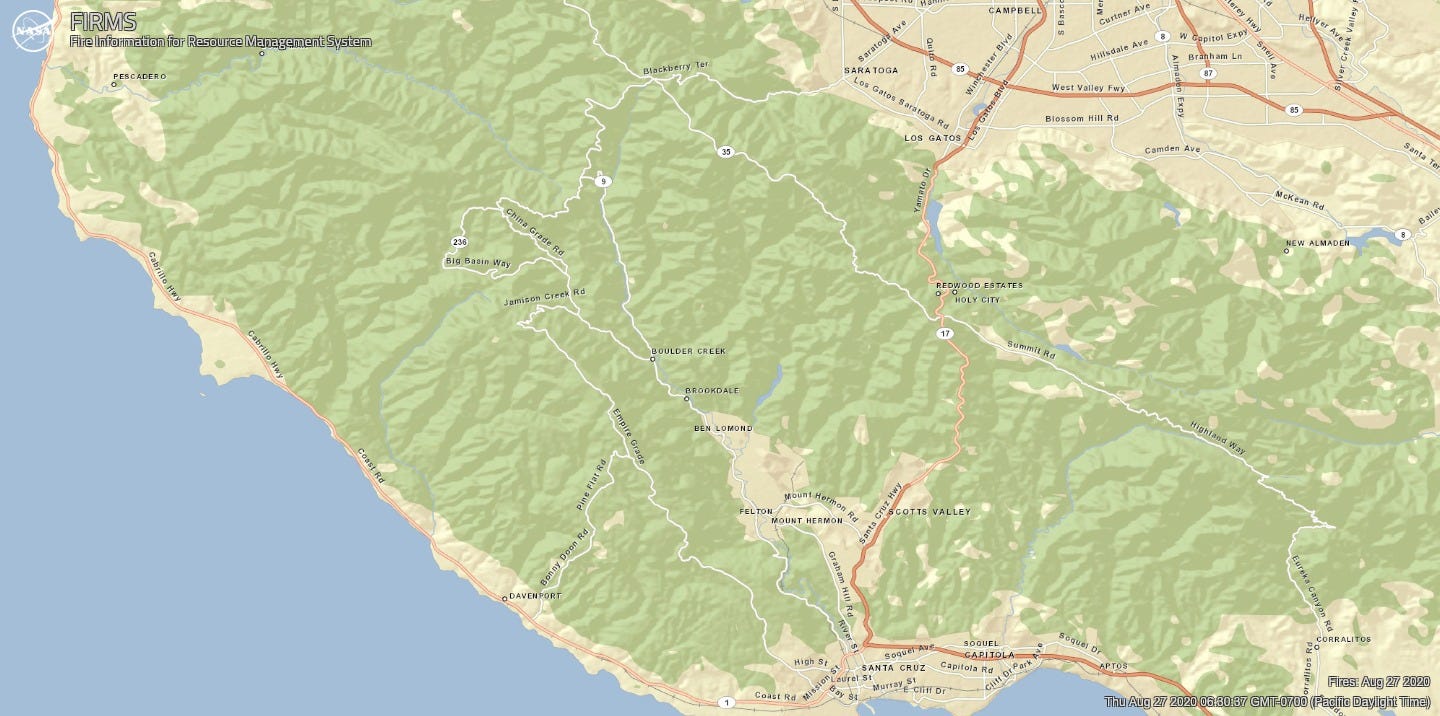
Satellite maps for August 27 show no fire detected in the CZU Lightning Complex, although they do show detections for the SCU Complex, confirming the passage of the satellites. I assume this is a combination of the marine layer and Cal Fire’s good work.

August 27, 2020. Satellite capture at 3:18 AM Pacific did not detect fire in the CZU Lightning Complex.

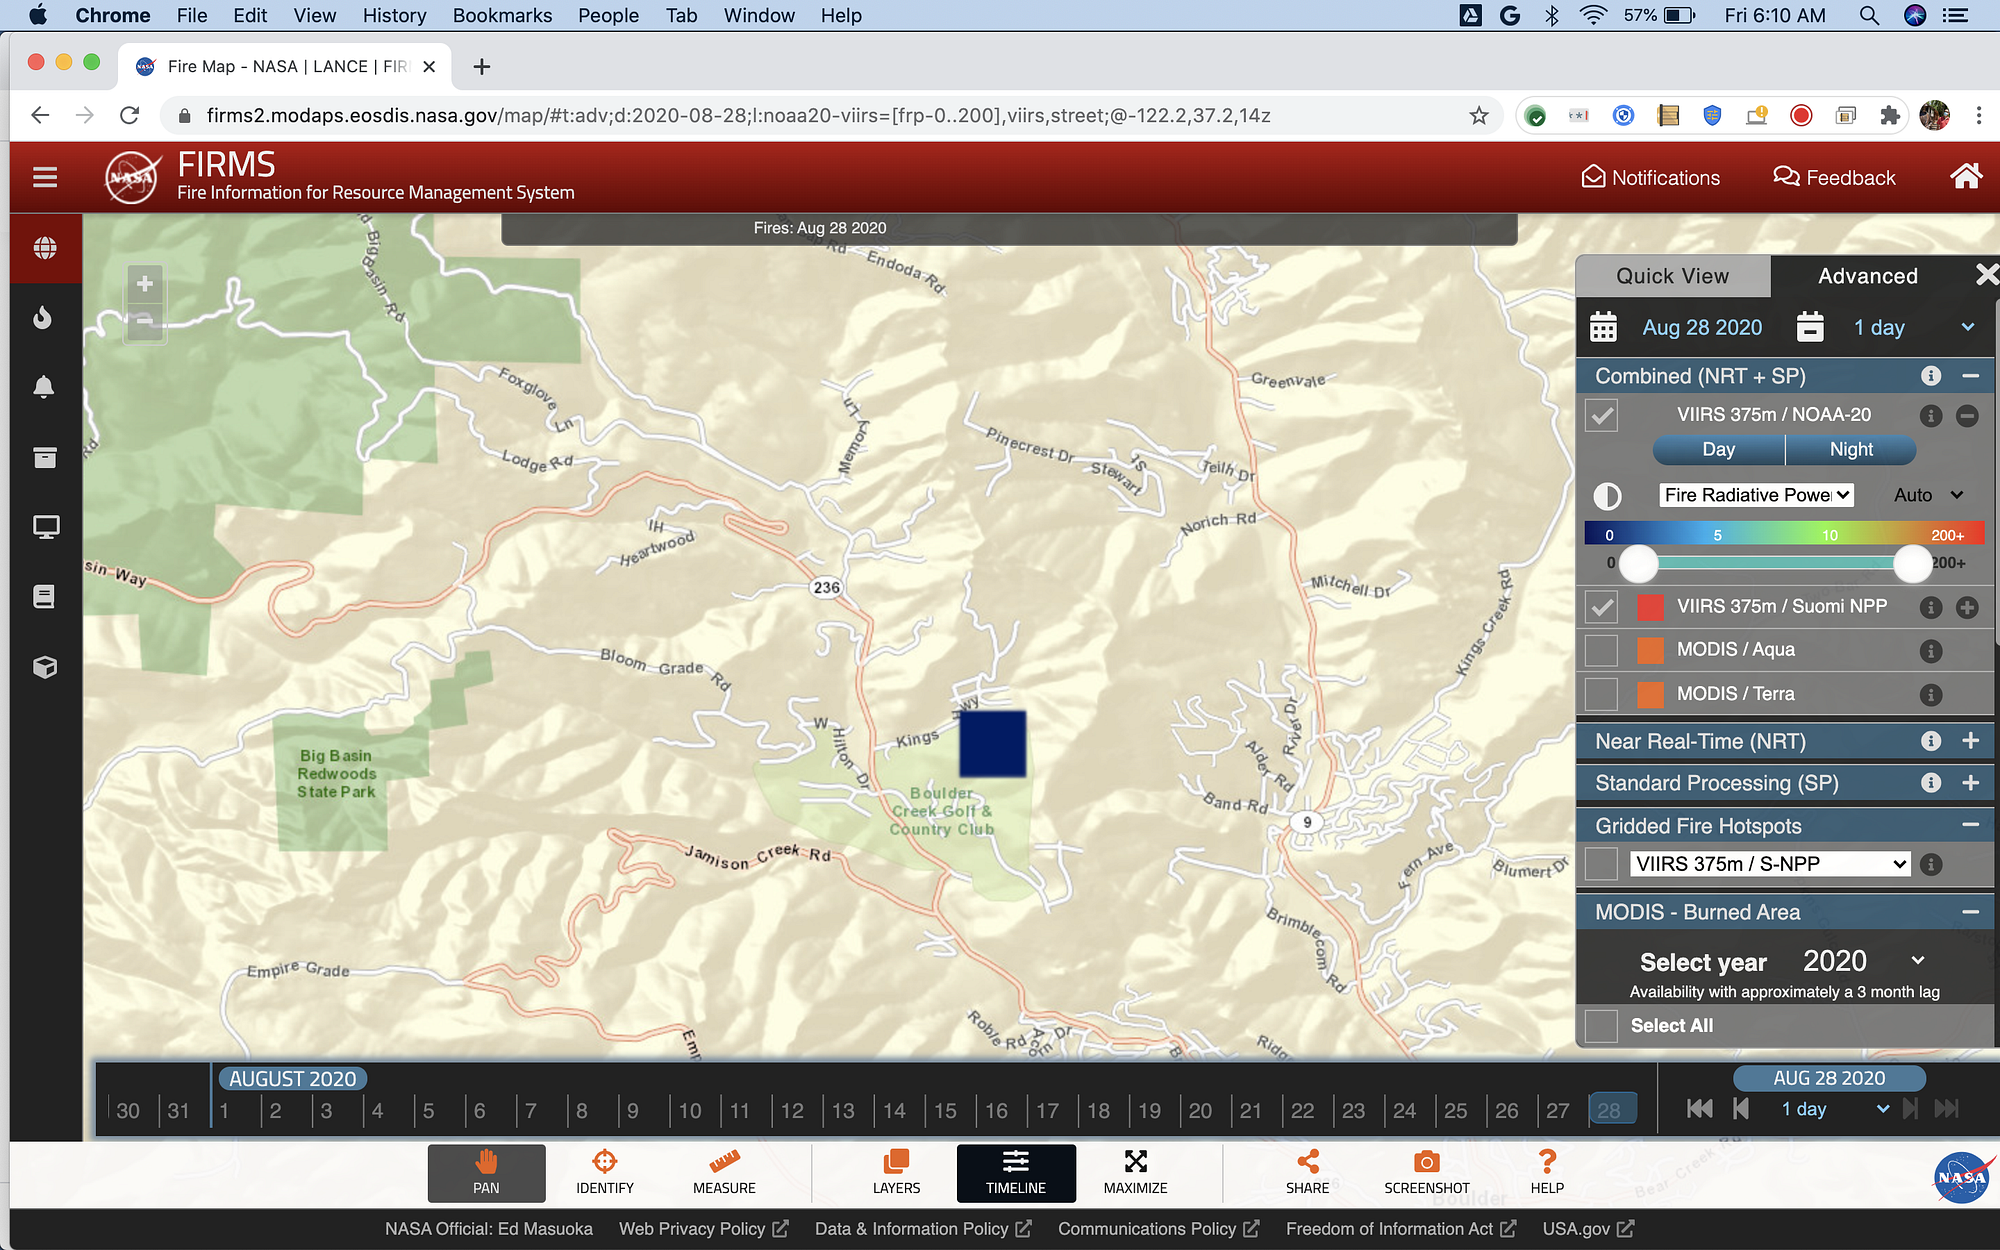
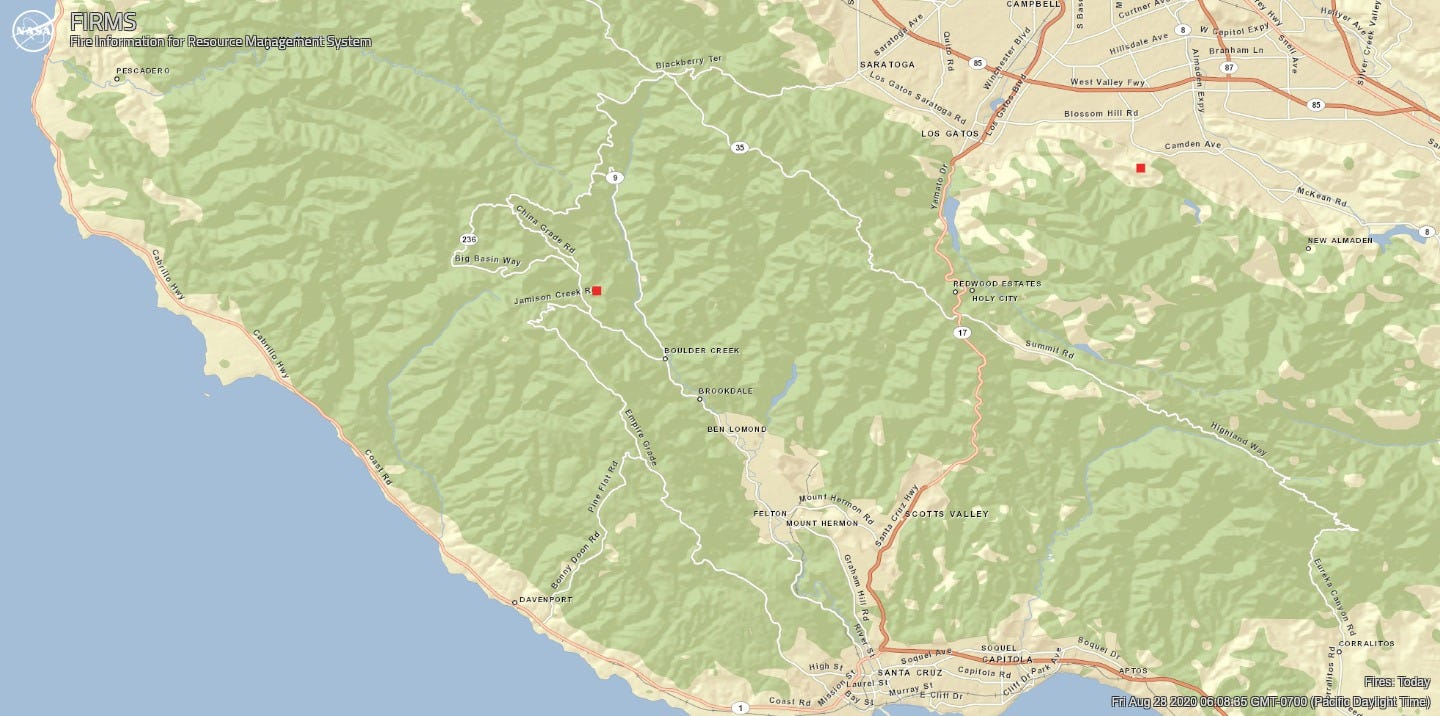
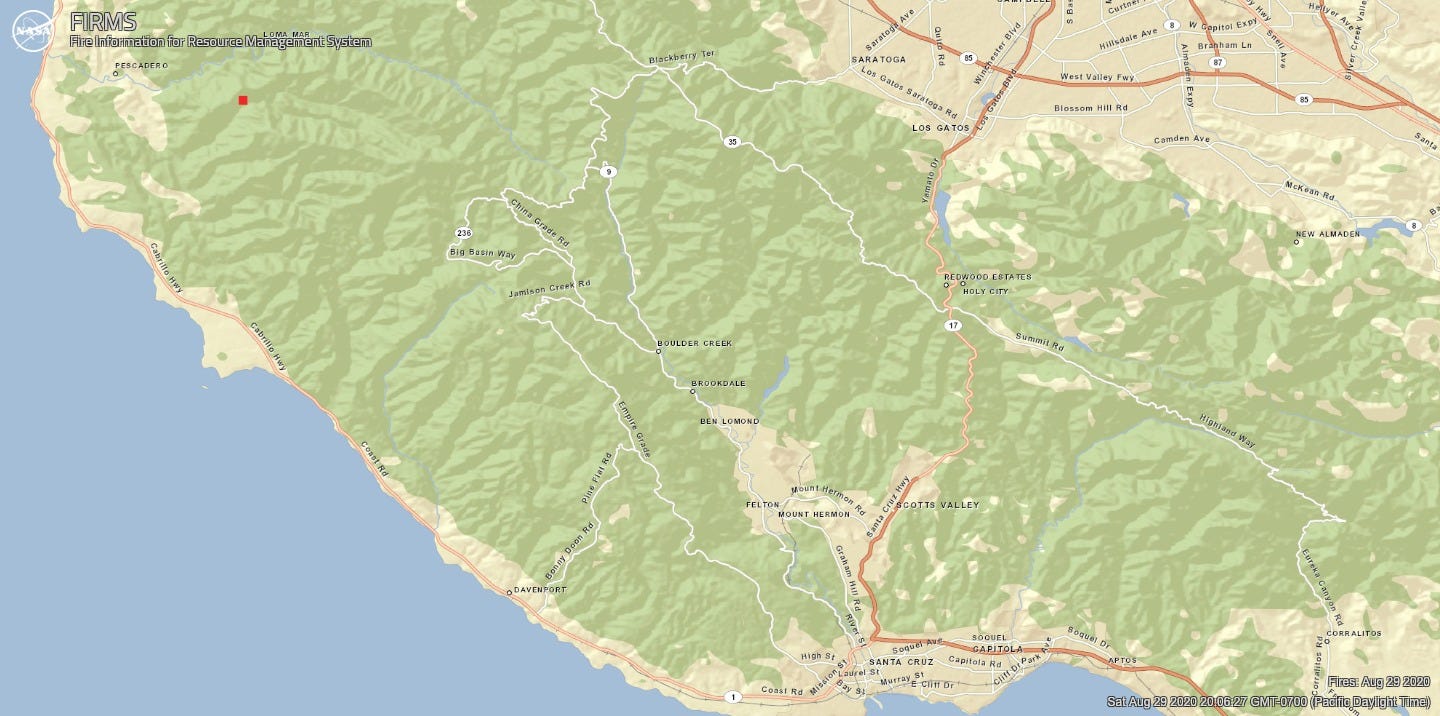
On August 28, satellites captured one hot spot near the Boulder Creek Golf & Country Club, at 3 AM Pacific.

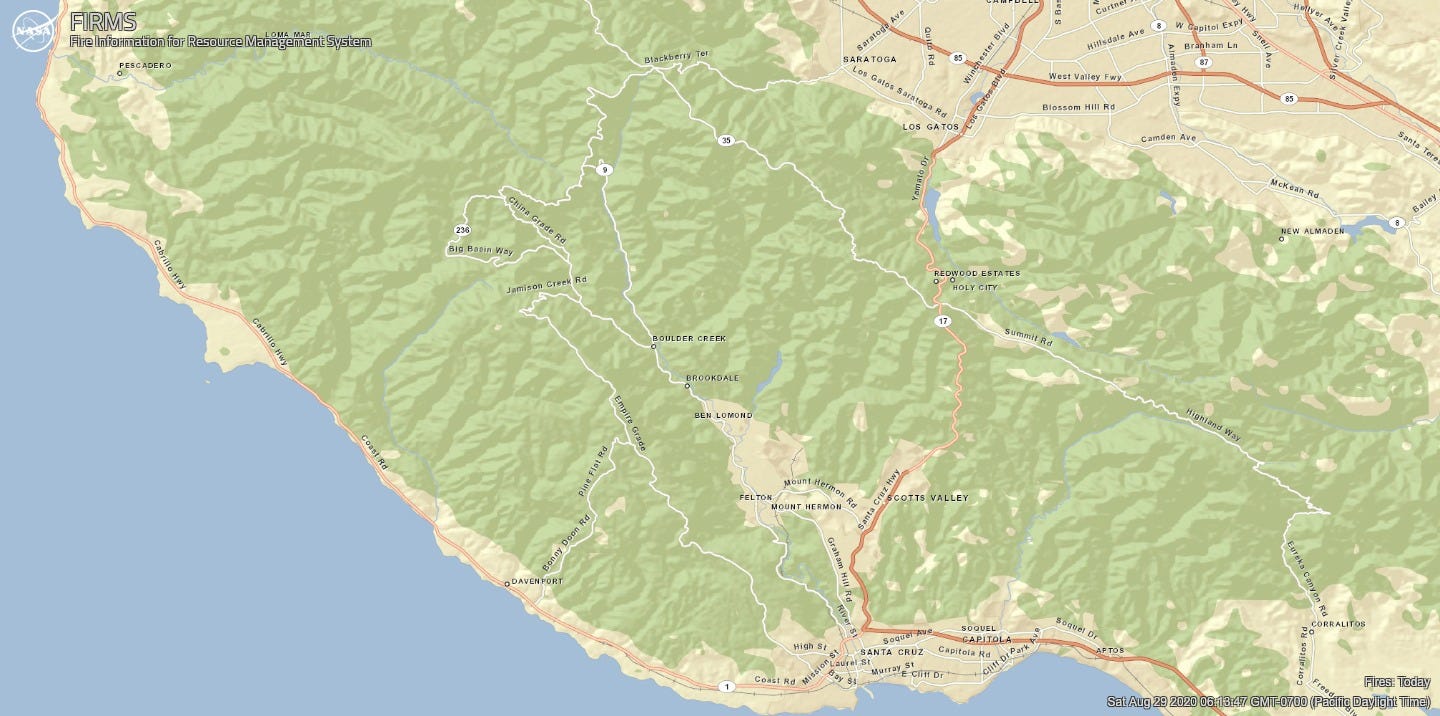
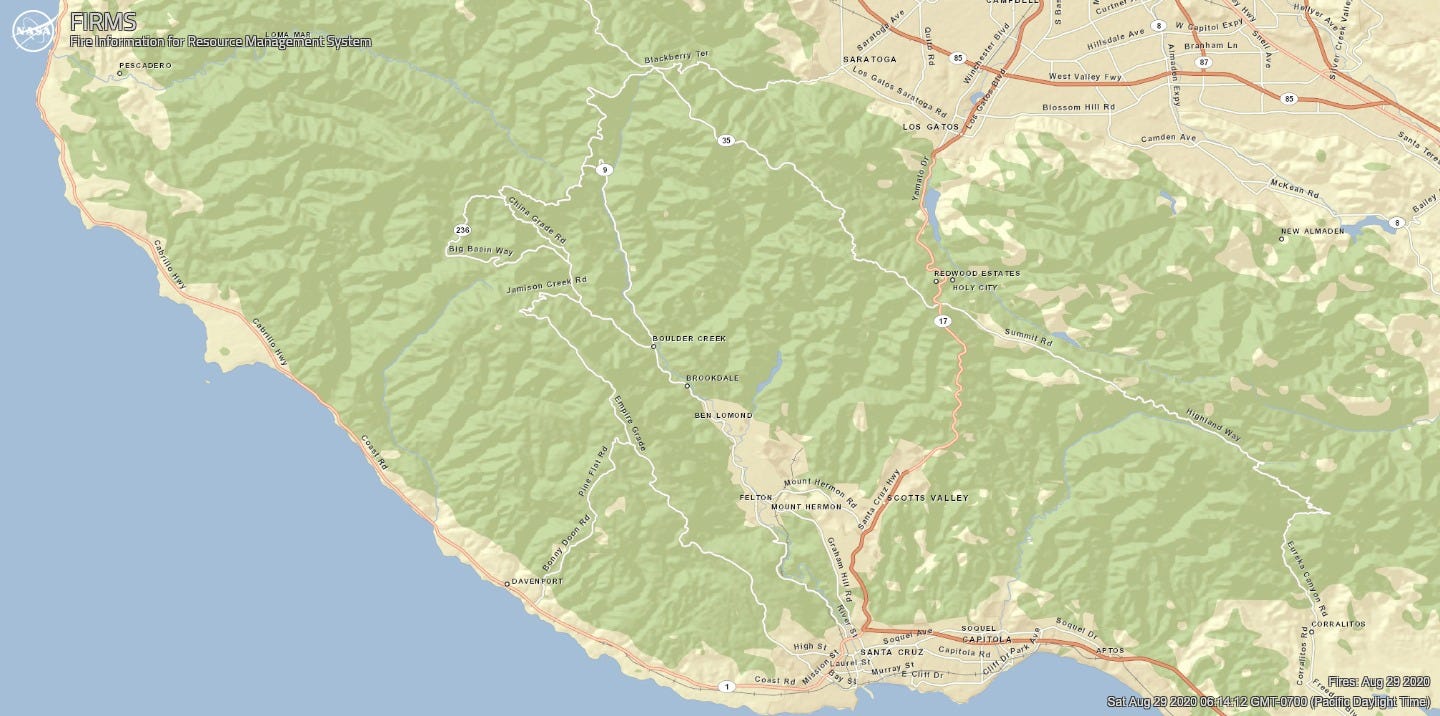
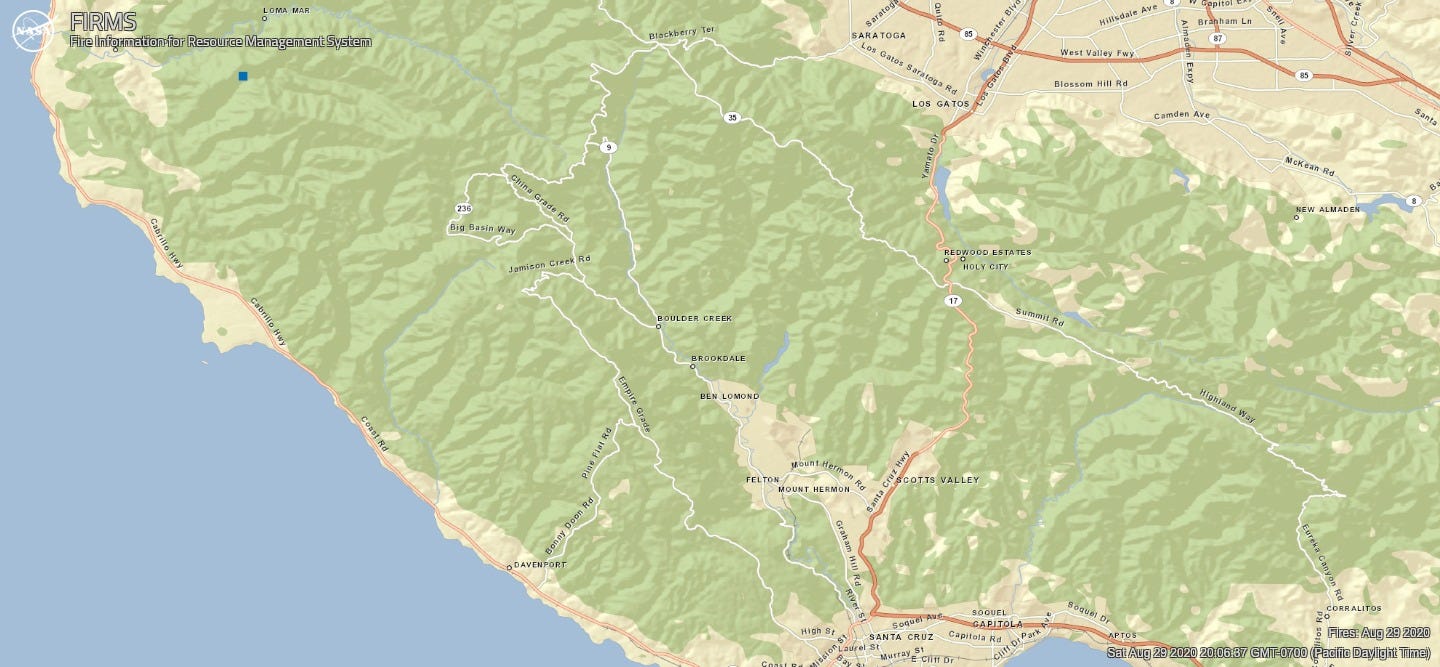
On the morning of August 29 there were no hotspots. Of course this doesn’t mean the fire is out, however, as this cool video from CALFIRECZU shows:

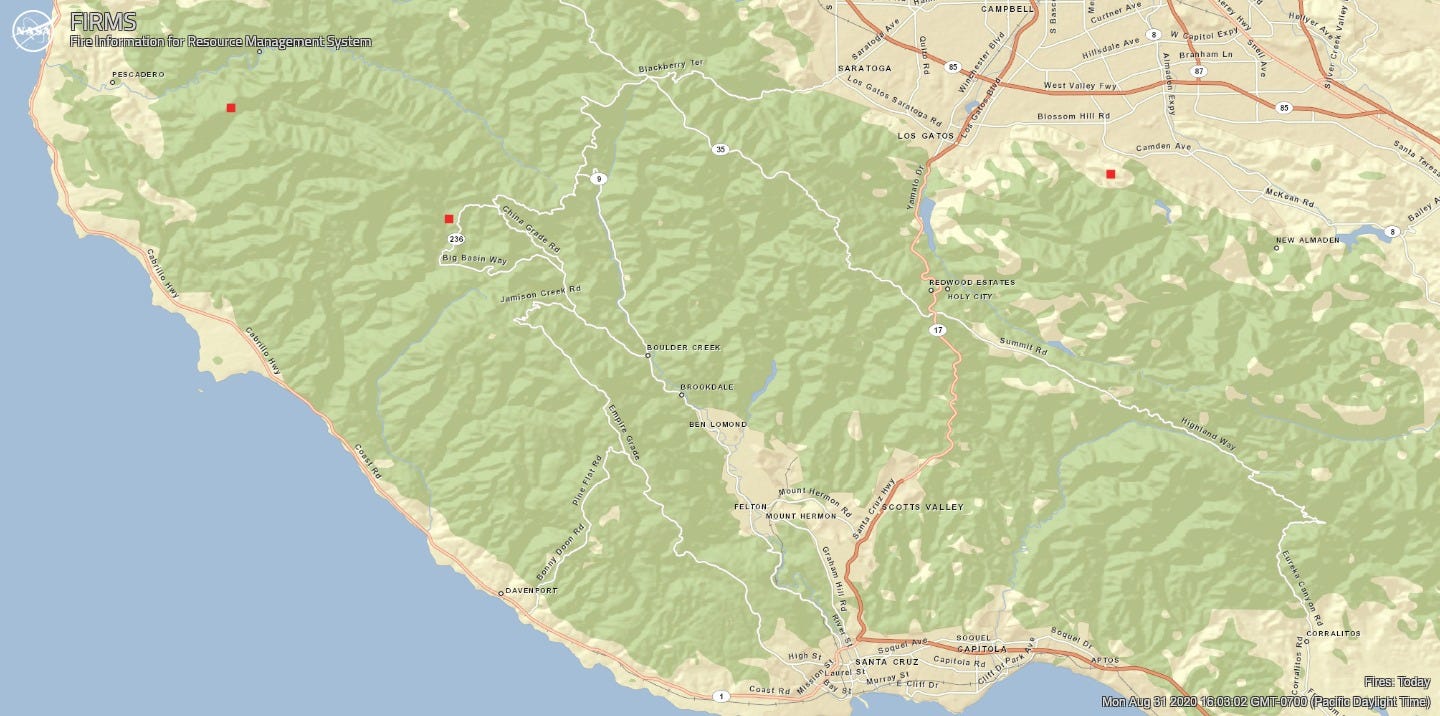
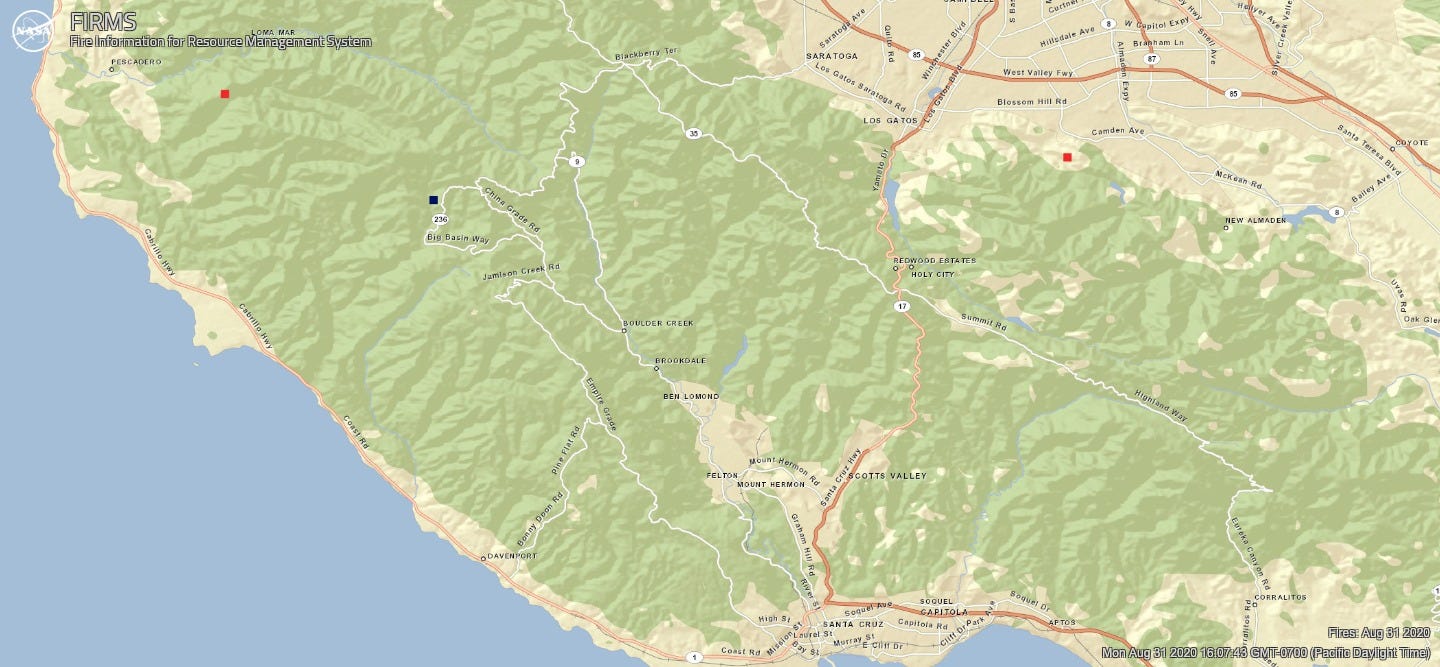
On August 30, satellite captures at 2:24 AM, 3:12 AM and 4:00 AM Pacific did not detect fire in the CZU Complex. On August 31 they detected two hotspots, one north of Butano State Park at 2:54 AM and another at 3:42 AM between N. Escape Road and Big Basin Way. No hotspots were detected the morning of September 1, with satellite captures at 2:36 AM and 3:24 AM. One hotspot north of Butano was captured at 1:54 PM Pacific.

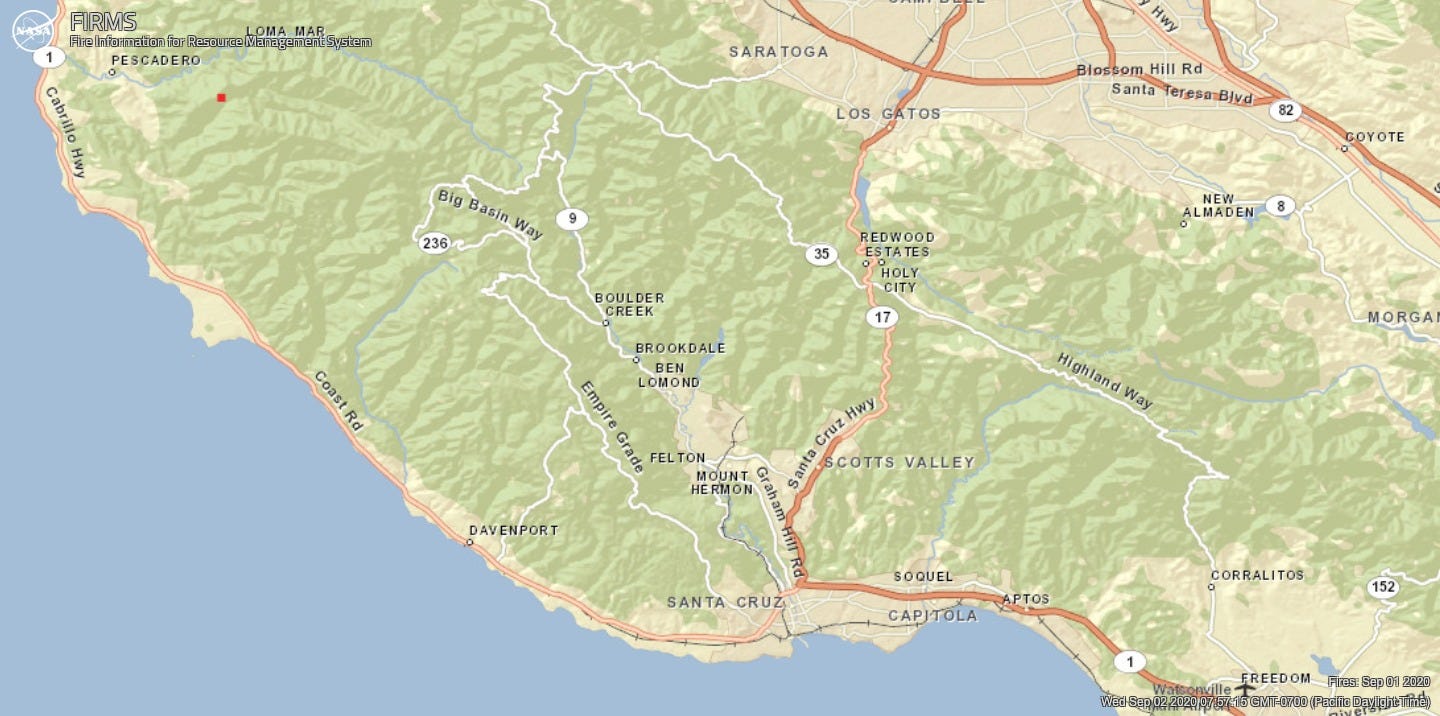
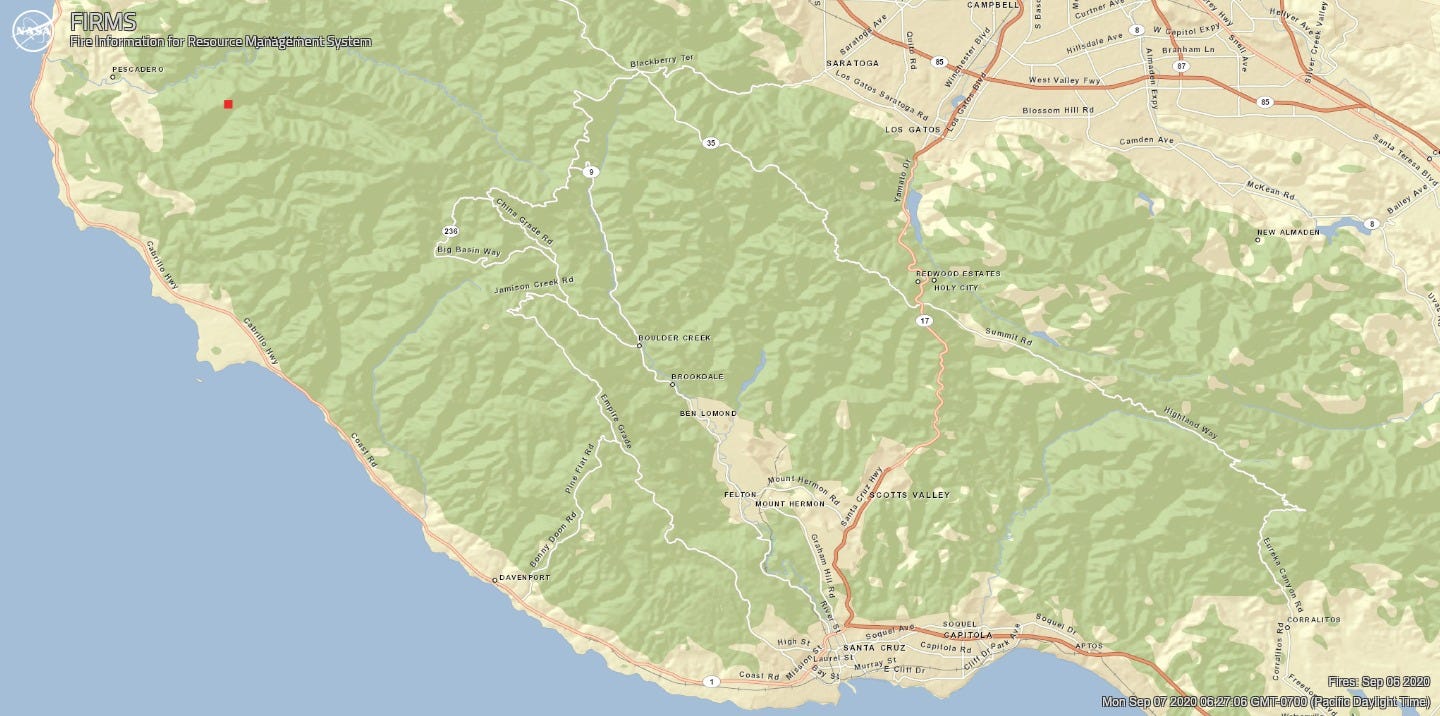
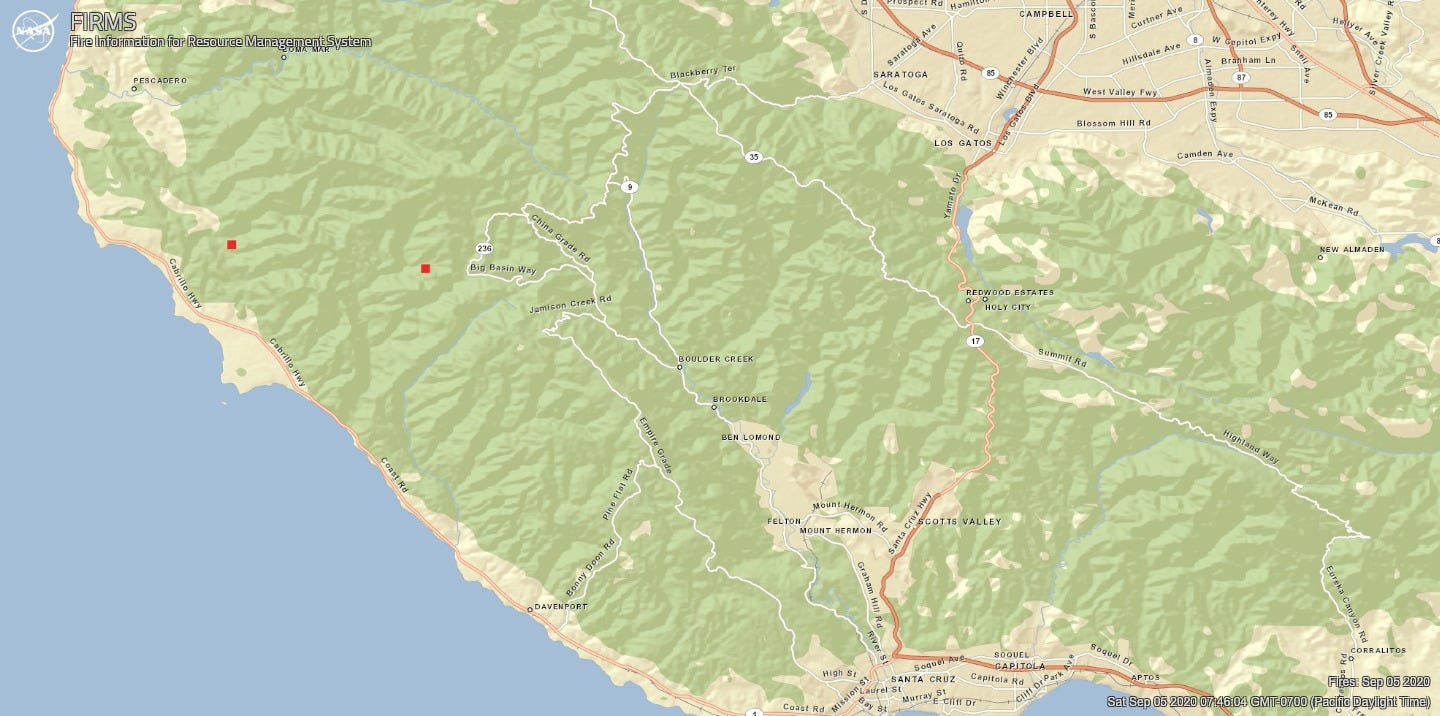
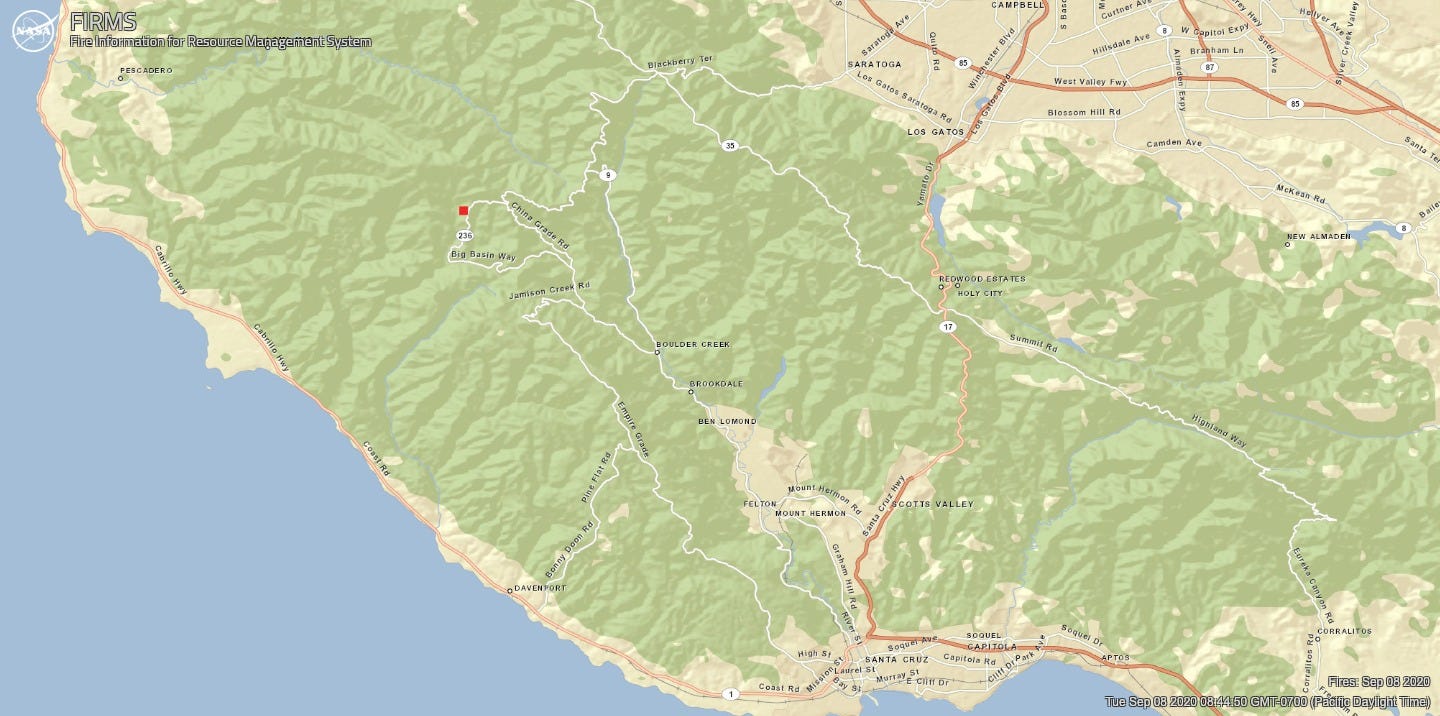
On September 2 it appears that no hotspots were captured in either the CZU or the SCU incidents, with satellites capturing a hotspot east of Livermore at 3:06 AM. Similarly the satellites passed with no hotspots detected on September 3 or September 4. On September 5, the impact of warmer weather was visible with two hotspots, one in Big Basin and one near Gazos Creek Rd, captured at 3 AM Pacific. They did not appear on daytime satellite captures. Satellites did capture one hotspot at 2 PM on September 6, north of Butano State Park. There were no detections on September 7, but on September 8 there was a hotspot between 236 and N. Escape Road, captured at 2:54 AM Pacific.

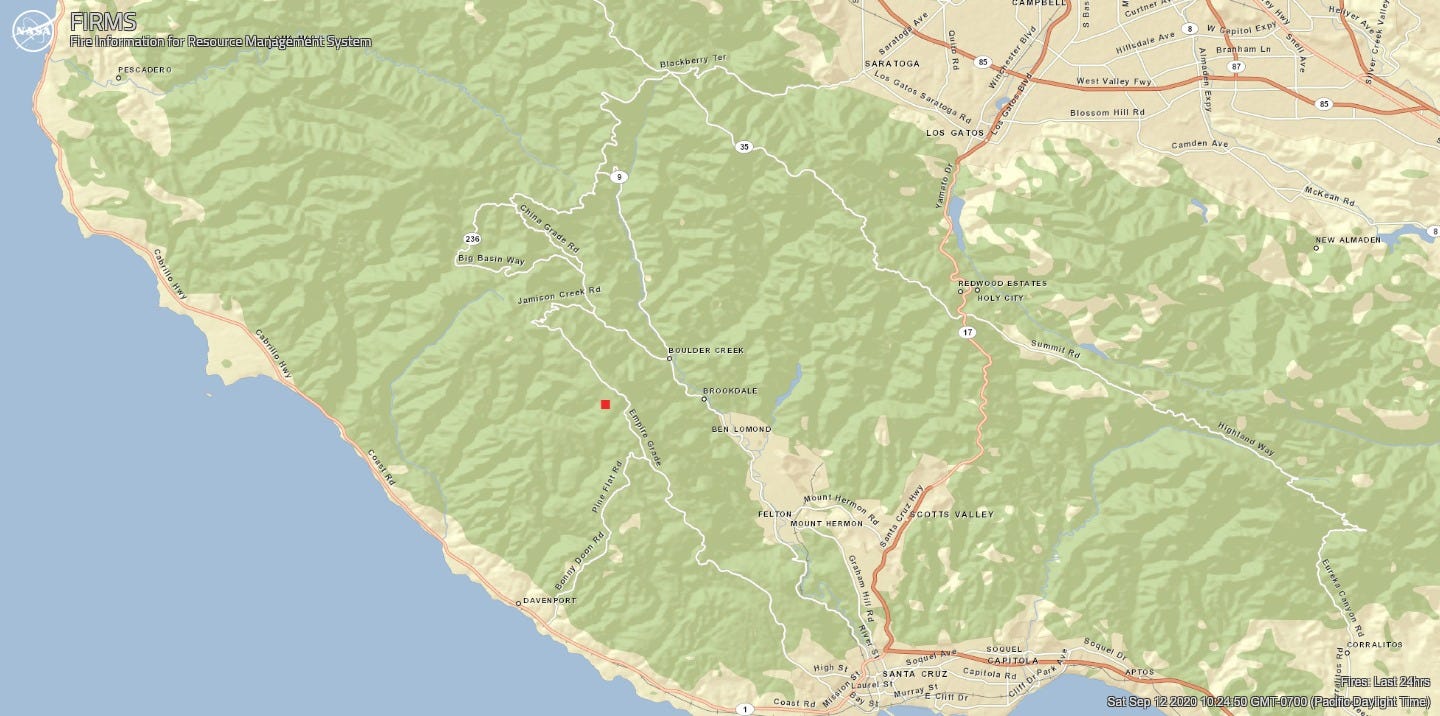
No hotspots were captured on 9, 10 or 11 September, but on 12 September the VIIRS system captured a hotspot at 3:18AM Pacific near the intersection of Empire Grade and Alba Road.

Thank you, firefighters, and everybody who finds a way to help our community through this disaster.

Sign up for The Bold Italic newsletter to get the best of the Bay Area in your inbox every week.

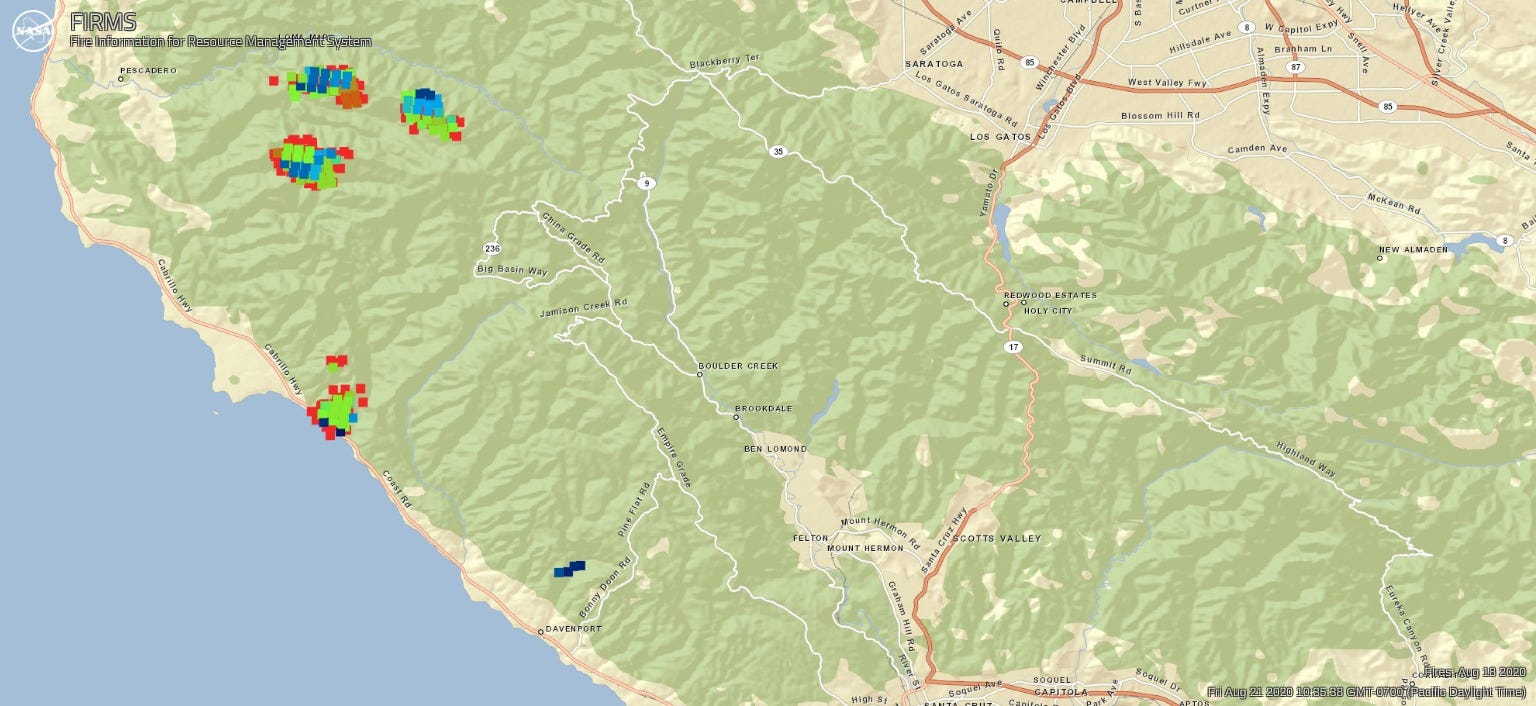
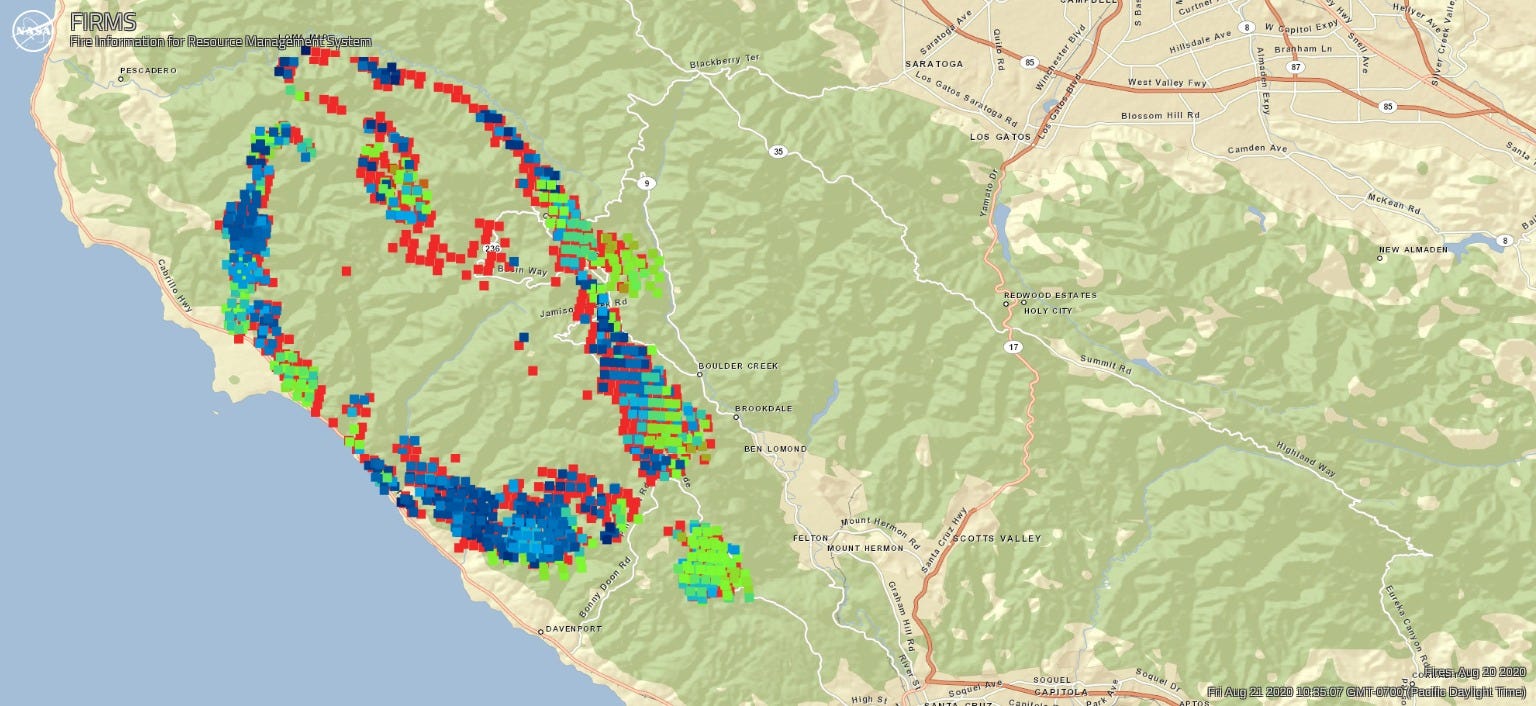
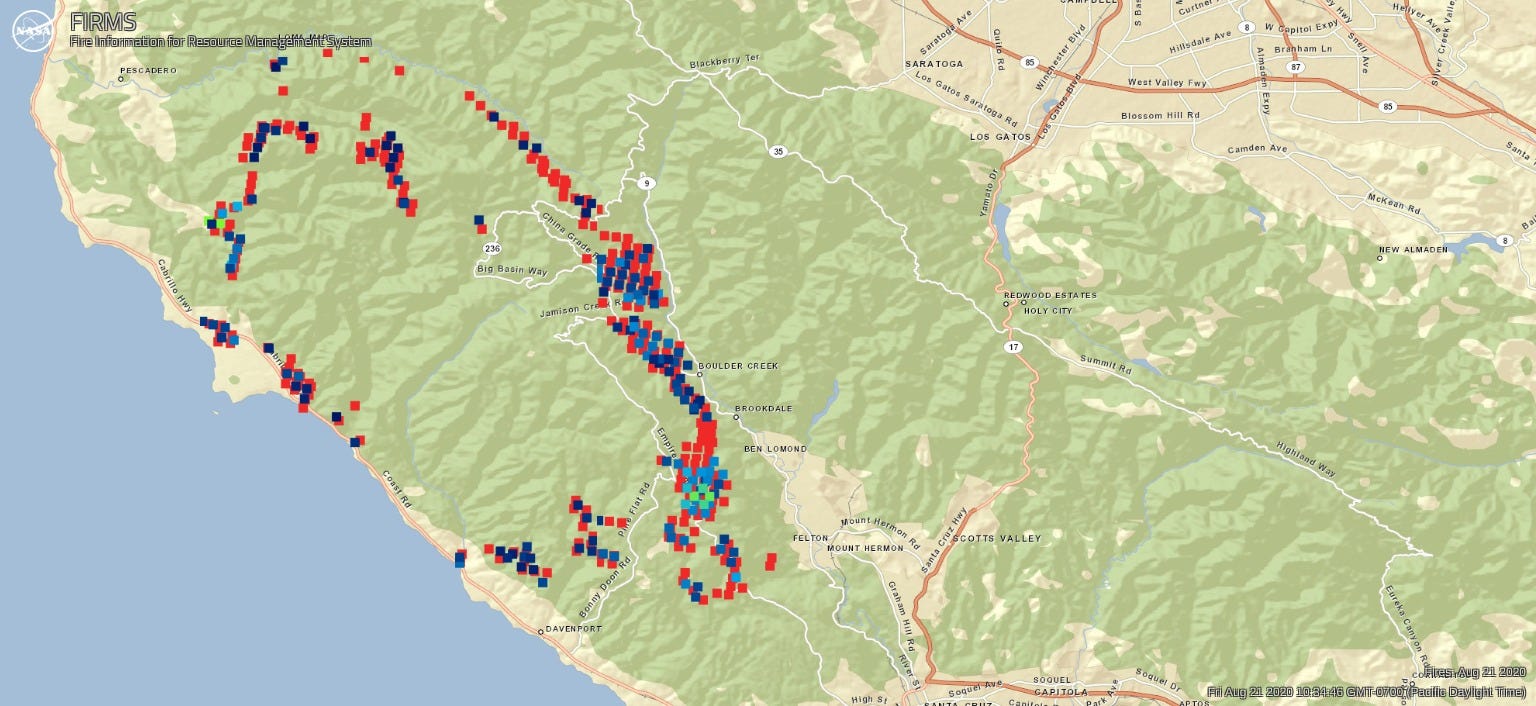
Series 1. CZU Lightning Complex, Near Real-Time view with default settings

Three small red dots near the coast southwest of San Jose.
August 16, 2020.
4 red areas (still small but bigger than the ones in the previous map) near the coast southwest of San Jose.
August 17, 2020.
4 red areas larger than those in the previous map near the coast southwest of San Jose.
August 18, 2020.
A large red area taking up most of the same map that’s been used throughout the post.
August 19, 2020.
The previous map, showing red areas that are more like the outline of an oval. There are some orange areas this time.
August 20, 2020.
The previous map, but the red oval outline near the coast is skinnier and broken-up.
August 21, 2020, 10:35am. All times PT.
The previous map, with a slightly thinner red oval outline.
August 21, 2020, 10:20pm.
The previous map, but the red outline is dotted and skinny.
August 22, 2020, captured 4am Pacific (estimated). Satellite data may be impacted by effects of marine layer.
The previous map, but the skinny red oval is slightly different in shape.
August 22, 2020, 10 pm.
The red oval is only faintly identifiable as such because the fire areas have shrunk and are disconnected dots.
August 23, 2020, 6:45am, from satellite capture around 2 am.
The previous map with only slight differences in the red areas.
August 23, 2020, 8:45pm.
The previous map, but the disconnected red dots are smaller.
August 24, 2020, satellite capture around 2:36 am.
August 24, 2020, generated at 8:30pm
August 25, 2020
August 26, 2020.
August 27, 2020.
August 28, 2020, satellite capture at 3 AM Pacific.
There were no hotspots in the satellite captures of August 29, 1:48 AM or 2:42 AM Pacific.
The satellite capture of August 29 at 2 PM Pacific picked up one hotspot north of Butano State Park.
August 30, 2020. No hotspots.
August 31, 2020. The hotspot near Hicks Road is a Waste Management facility.
On September 1, one hotspot was captured at 1:54 PM Pacific. No hotspots were detected on 2–4 September.
September 5. Two hotspots seem to reflect the return of hot fire weather.
September 6, 2 PM Pacific. One hotspot north of Butano State Park.
On September 8 one hotspots was detected between 236 and N Escape Road, at 2:54 AM Pacific.
On September 12, VIIRS captured one hotspot near the top of Alba Road at 3:18 AM Pacific.
Screenshot of a browser window showing the map used throughout the post, with a thicker outline and a toolbar on the right.
CZU Lightning Complex, showing the setting used to produce Series 1.

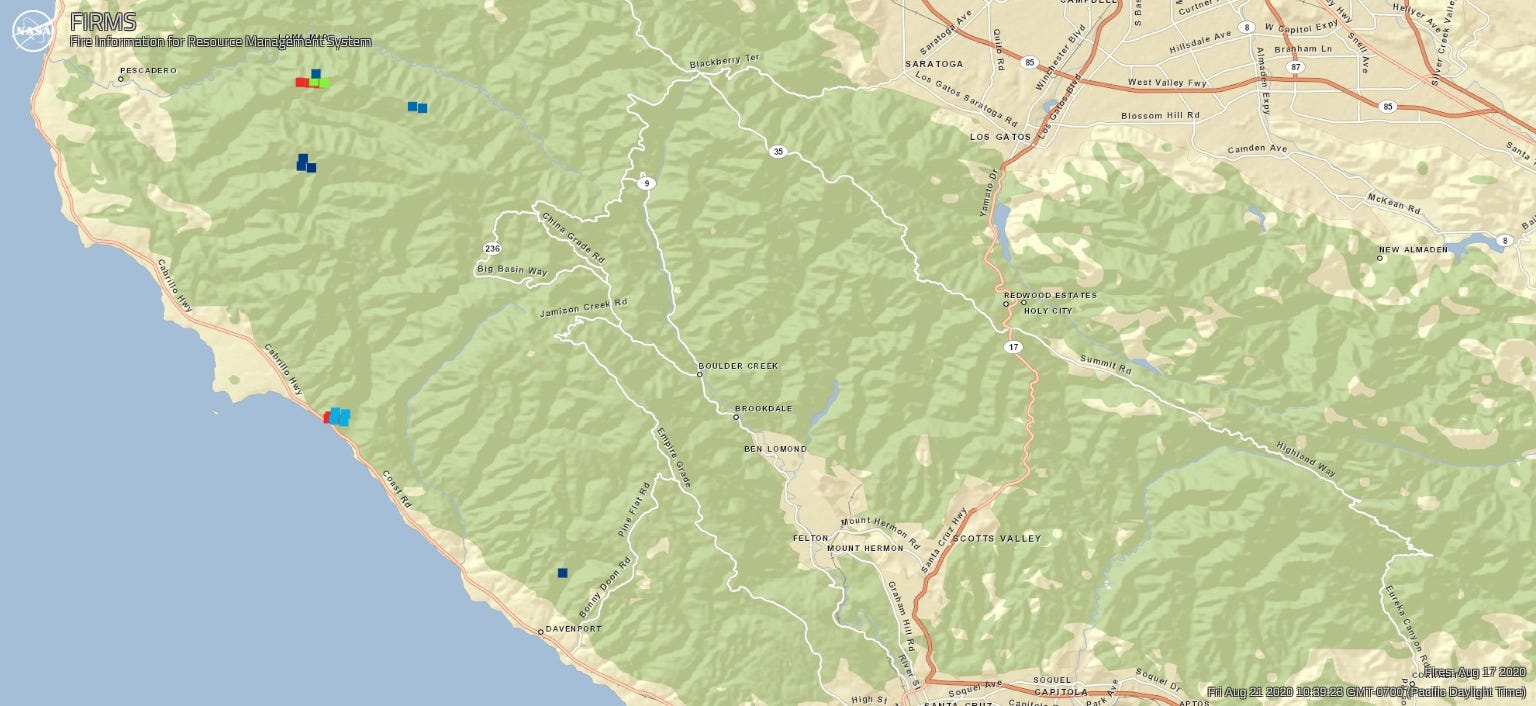
Series 2: CZU Lightning Complex, Near Real-Time view settings to show Fire Radiative Power

The map used throughout the post, with three small red dots; near the coast is a tiny cluster of red and blue dots.
August 16, 2020.
The map, with small blue dots toward the northwest.
August 17, 2020.
The map, with 4 slightly bigger clusters of red, green, and blue dots.
August 18, 2020.
A large cluster of green, blue, and red dots taking up about a third of the map to the northwest.
August 19, 2020.
An oval outline of blue, green, and red dots to the northwest of the map, next to the coast.
August 20, 2020.
A thinner oval outline of dark blue, red, and orange dots in the northwest, close to the coast.
August 21, 2020, 10:35 am.
The previous map, but part of the oval is thicker.
August 21, 2020, 10:20 pm.
The previous map, but the oval outline is thinner and mostly dark blue.
August 22, 2020, captured around 4 am. Satellite data may be impacted by effects of marine layer.
The previous map but the oval outline is slightly differently shaped.
August 22, 2020, 10 pm.
The previous map, but the blue outline is sparse and broken-up.
August 23, 2020, 6:45am, from a satellite capture around 2 am.
The previous map, but the blue areas have slightly shifted.
August 23, 2020, 8:45 pm.
The previous map, but the dots are sparser and there’s a bit more red.
August 24, 2020, from satellite capture around 2:36 am.
August 24, 2020, generated 8:30 pm
August 25, 2020.
August 26, 2020.
August 27, 2020. Satellite capture at 3:18 AM Pacific did not detect fire in the CZU Lightning Complex.
August 28, 2020, satellite capture at 3 AM Pacific.
There were no hotspots in the satellite captures of August 29, 1:48 AM or 2:42 AM Pacific.
The satellite capture of August 29 at 2 PM Pacific picked up one hotspot north of Butano State Park.
August 30, 2020. No hotspots.
August 31, 2020 shows two hotspots in the CZU zone. The hotspot near Hicks Road is a Waste Management facility.
On September 1, one hotspot was captured at 1:54 PM Pacific. No hotspots were detected on 2–4 September.
September 5. Two hotspots seem to reflect the return of hot fire weather.
September 6, 2 PM Pacific. One hotspot north of Butano State Park.
On September 8 one hotspots was detected between 236 and N Escape Road, at 2:54 AM Pacific.
On September 12, VIIRS captured one hotspot near the top of Alba Road at 3:18 AM Pacific.
Screenshot of a browser window showing the dark blue oval outline with more red, and a settings sidebar to the right.
\\CZU Lightning Complex, showing the settings used to produce Series 2.

Where to Get Live Updates on the California Wildfires
Stay informed about where the flames are spreading and what evacuations are taking place
Why the Fires Feel More Unsettling This Time
California’s dreaded fire season is once again upon us, but this year it feels more foreboding

Last Update: December 15, 2021

Author

J. Bradley Chen 1 Article

Subscribe to our Newsletter

Subscribe to our email newsletter and unlock access to members-only content and exclusive updates.