

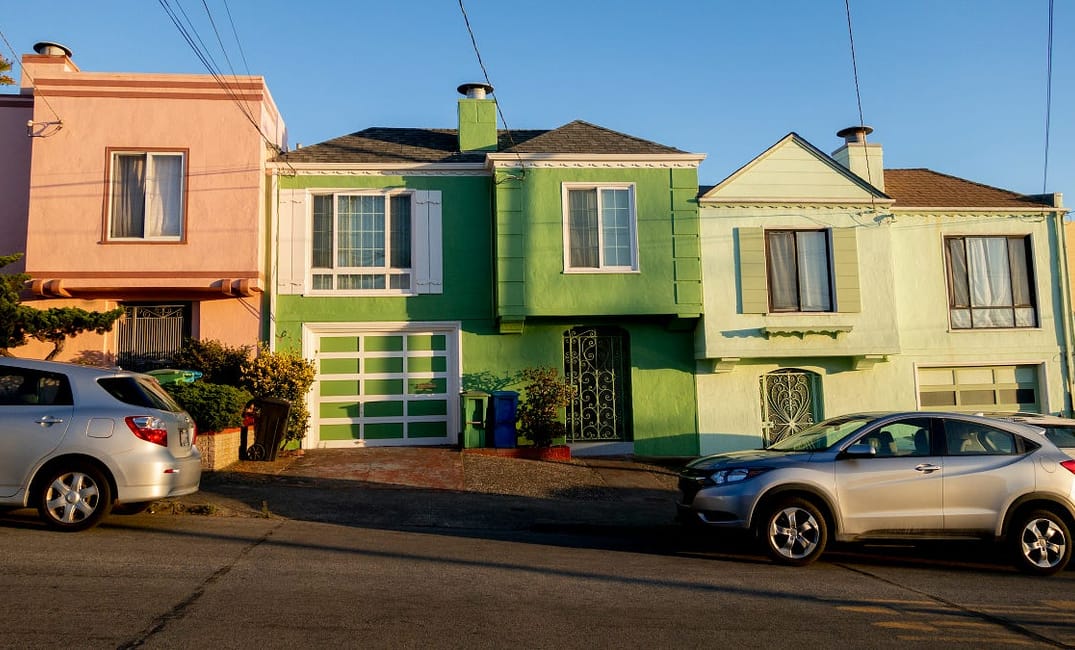
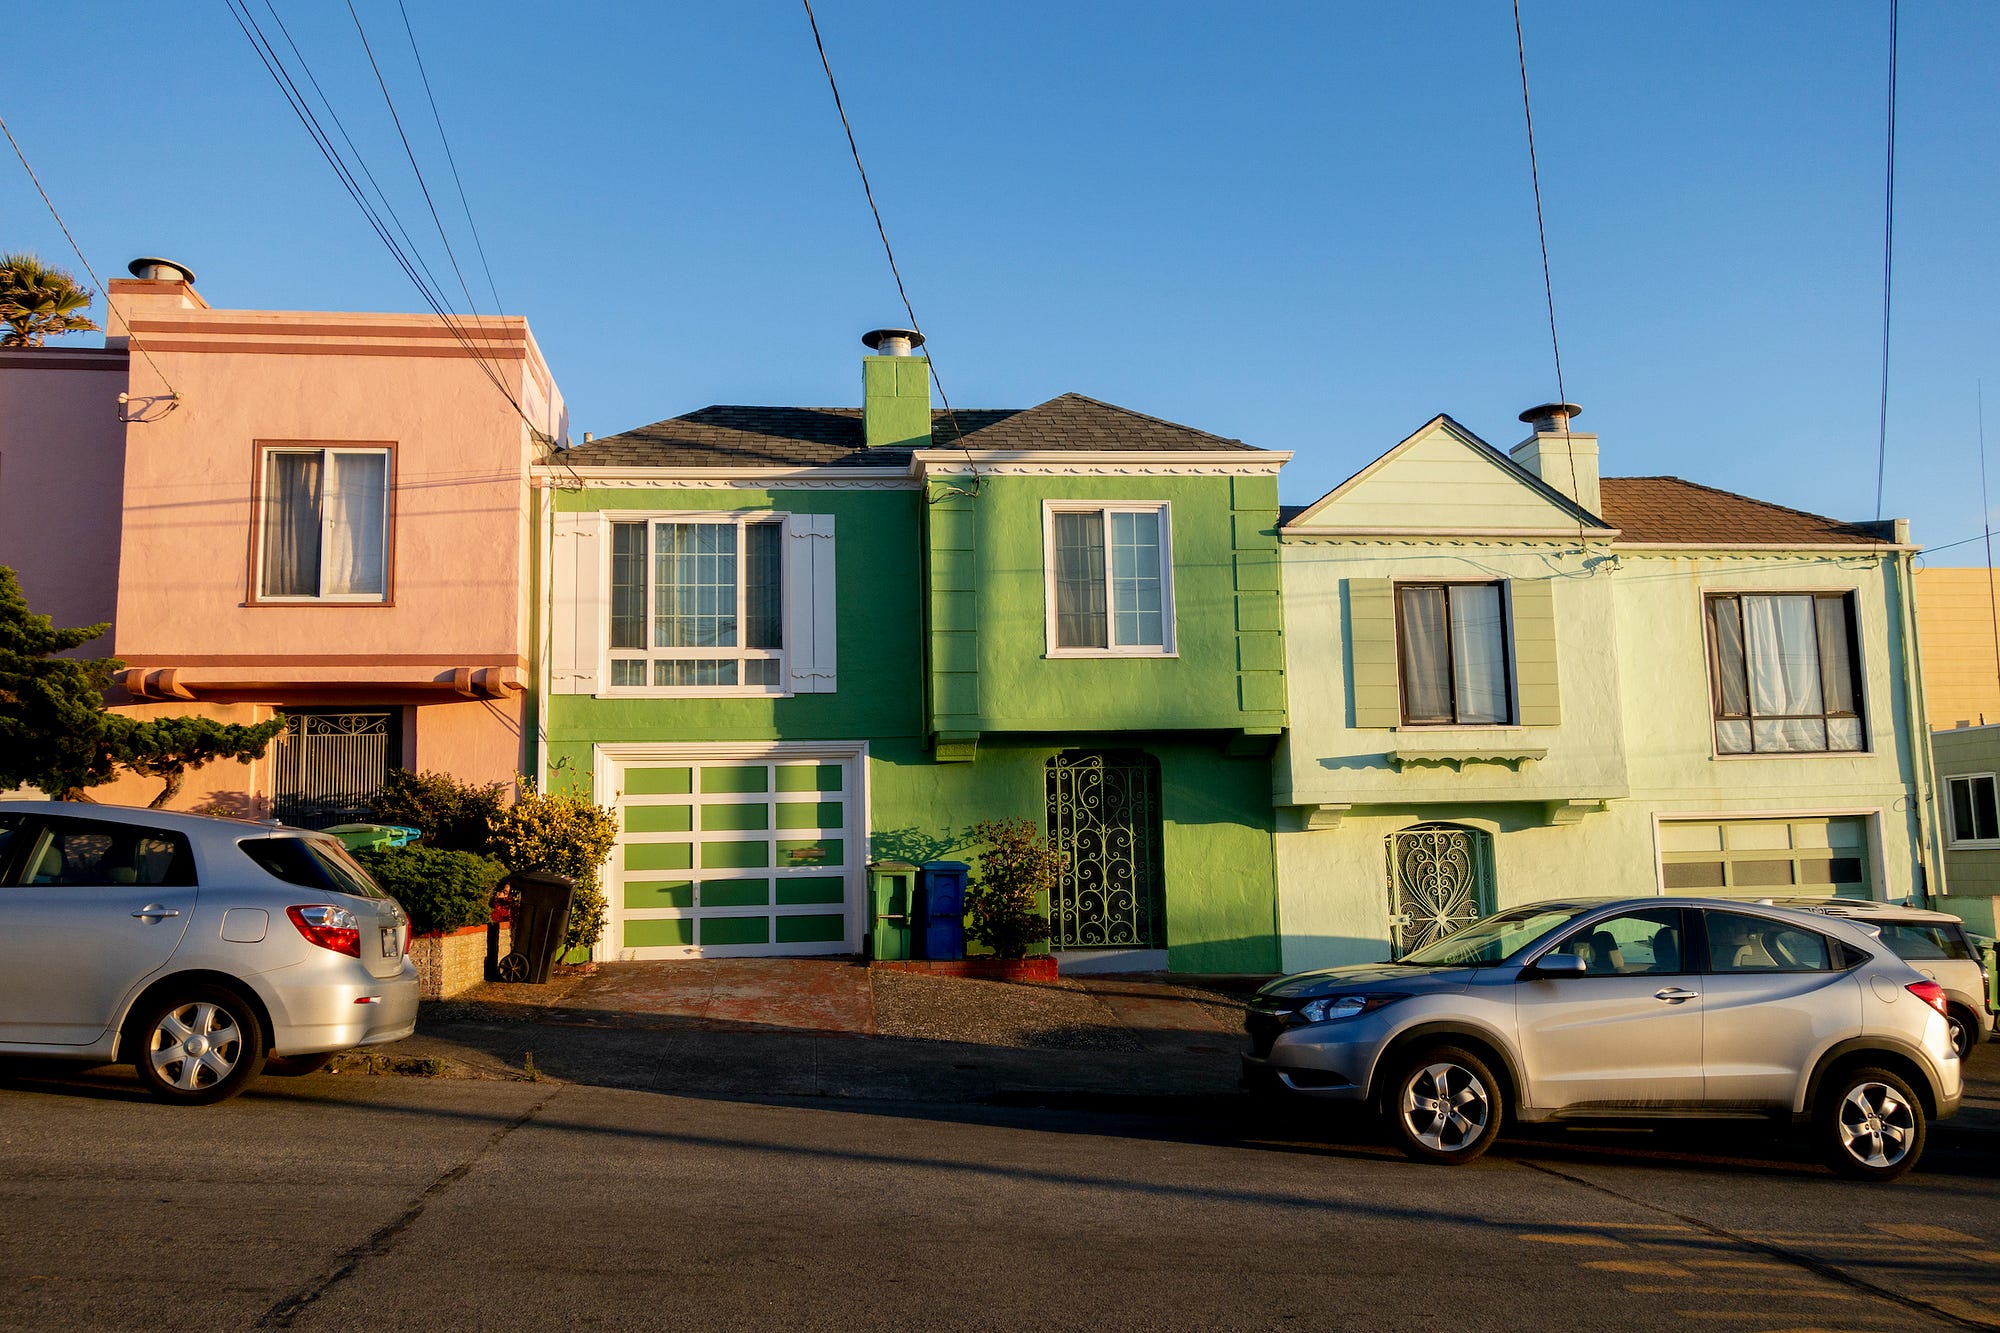
I just learned that my landlord, who inherited our property just over a year ago, pays less than $1,500 in annual property taxes on a Noe Valley apartment that Zillow currently values at $1.5 million, while neighbors directly across the street are paying $24,000 per year on a similarly valued apartment.
Welcome to California.
This discrepancy is the legacy of Proposition 13, California’s infamous 1978 measure that limits property taxes to 1% of the assessed value at the time of purchase and caps increases at 2% per year until the property changes hands and is reassessed (with some notable exceptions, like inheritance).
While the amount your landlord and neighbor pay in property taxes has always been public data, it’s been hidden and hard to find on individual county websites, in lookup systems, or, frustratingly, on private sites behind paywalls. But now, thanks to Bay Area software engineer Ian Webster, these differences are laid out for all to see on a new open-source California property tax map.
Sign up for The Bold Italic newsletter to get the best of the Bay Area in your inbox every week.
These insights arrive just as California voters are making crucial decisions on Propositions 15 and 19 in next week’s election. Prop. 15 could be the beginning of undoing decades of disinvestment and inequitable taxation, dismantling tax loopholes for industrial and commercial properties and raising billions for schools and local governments.
Prop. 19, on the other hand, is a mixed bag. While it would end a tax break that allows the inheritance of low tax assessments for investment or vacation properties, it would also expand Prop. 13 privileges for homeowners over 55 (as well as those with disabilities and victims of natural disasters). Prop. 19 would allow these homeowners to transfer low property tax assessments when they move to a new home, anywhere in the state of California, up to three times. This could reinforce existing inequalities between older homeowners and, well, the rest of us.
In making the tool, Webster has scraped data from more than 5 million property tax webpages to build a visualization of the legacy of Proposition 13.
“Prop. 13’s effects are right under our noses,” Webster says. “I really wanted to see the numbers myself instead of taking someone’s word for it.”
Knowing that neighbors could theoretically be paying extremely different tax rates on houses of equal value is one thing. But seeing it mapped out in your own neighborhood feels personal.
“What surprises most people is just how easy it is to find examples that make you say, ‘Is this really the way it should be?’ So, when you see very large disparities between people who are living in the same area or building, it definitely makes you wonder,” Webster says.
Webster has his own political opinions, but he wants the tool to be a neutral source of information.
The data can speak for itself,” he says. “I focused on providing facts the public can use.”
The tool has struck a chord on Twitter and Reddit. So far, many of the comments are from owners reflecting on their own sky-high payments compared to next-door neighbors, or renters calling out legacy landlords for rock-bottom tax contributions. One Twitter user reported getting banned from his local Nextdoor community after posting the map on the site.
While it’s easy to get mad at your neighbors or landlord over such blatant inequality, as many of the replies to Webster’s post have noted, the real culprit is the policy. Critics say Proposition 13 has led to vast discrepancies in taxation, decimated education funding in California, and created perverse incentives for local governments trying to raise revenue to fund essential operations and services. It’s time to channel that anger into voting.
Proposition 15 offers a split-roll solution: repealing the portions of Proposition 13 that apply to industrial and commercial properties, while leaving existing policies in place for residential property. Proposition 15 won’t apply to owners of commercial property worth less than $3 million, mixed-use buildings that are more than 75% residential, or agricultural land.
If Proposition 15 passes, it would raise up to an estimated $11.5 billion for schools and local communities, according to the state Legislative Analyst’s Office. A July report released by supporters of Proposition 15 finds that over 90% of new revenue would come from just 10% of the largest commercial properties in California.
Webster is working on a filter that lets viewers examine the property tax rates of commercial properties, but zoning data isn’t available for every county. His data comes from county property tax pages, which often store maps of parcels (properties), zoning information, and property tax information on separate pages.
“Most of the data wasn’t easy to come by. It had to be done through a very tedious process, and that process has to be repeated for each county,” Webster says.
While real estate research and data company PropertyShark built a similar tool a few years ago, it required a paid membership to compare individual properties. Webster’s tool is free and open source.
“The data that I’m working with is public data, so in my mind, public data should be free and open. If I have that data, I should make it available to everyone,” he says.
Webster began with the San Francisco Bay Area. Over the past few days, he and a few enthusiastic volunteers added Sacramento, Santa Cruz, Contra Costa, Yolo, and Los Angeles counties. He’s working on adding more: San Diego is high priority, along with a few others requested by users.
“Any help I can get, I’m grateful for. The breadth of the data is what makes the map so interesting,” he says.
Check out the project on Webster’s GitHub.
The Bold Italic is a not-for-profit media organization, and we publish first-person perspectives about San Francisco and the Bay Area. We operate under a fiscal sponsorship of a 501(c)(3).
You can become a paid subscriber. Or donate. Or learn more about us.