
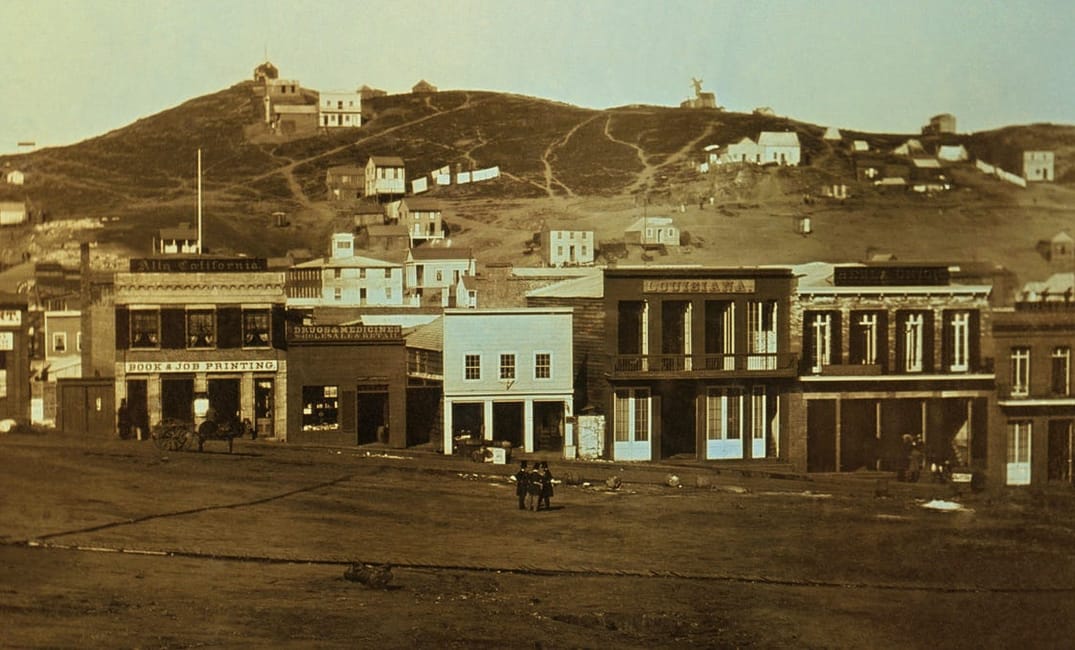
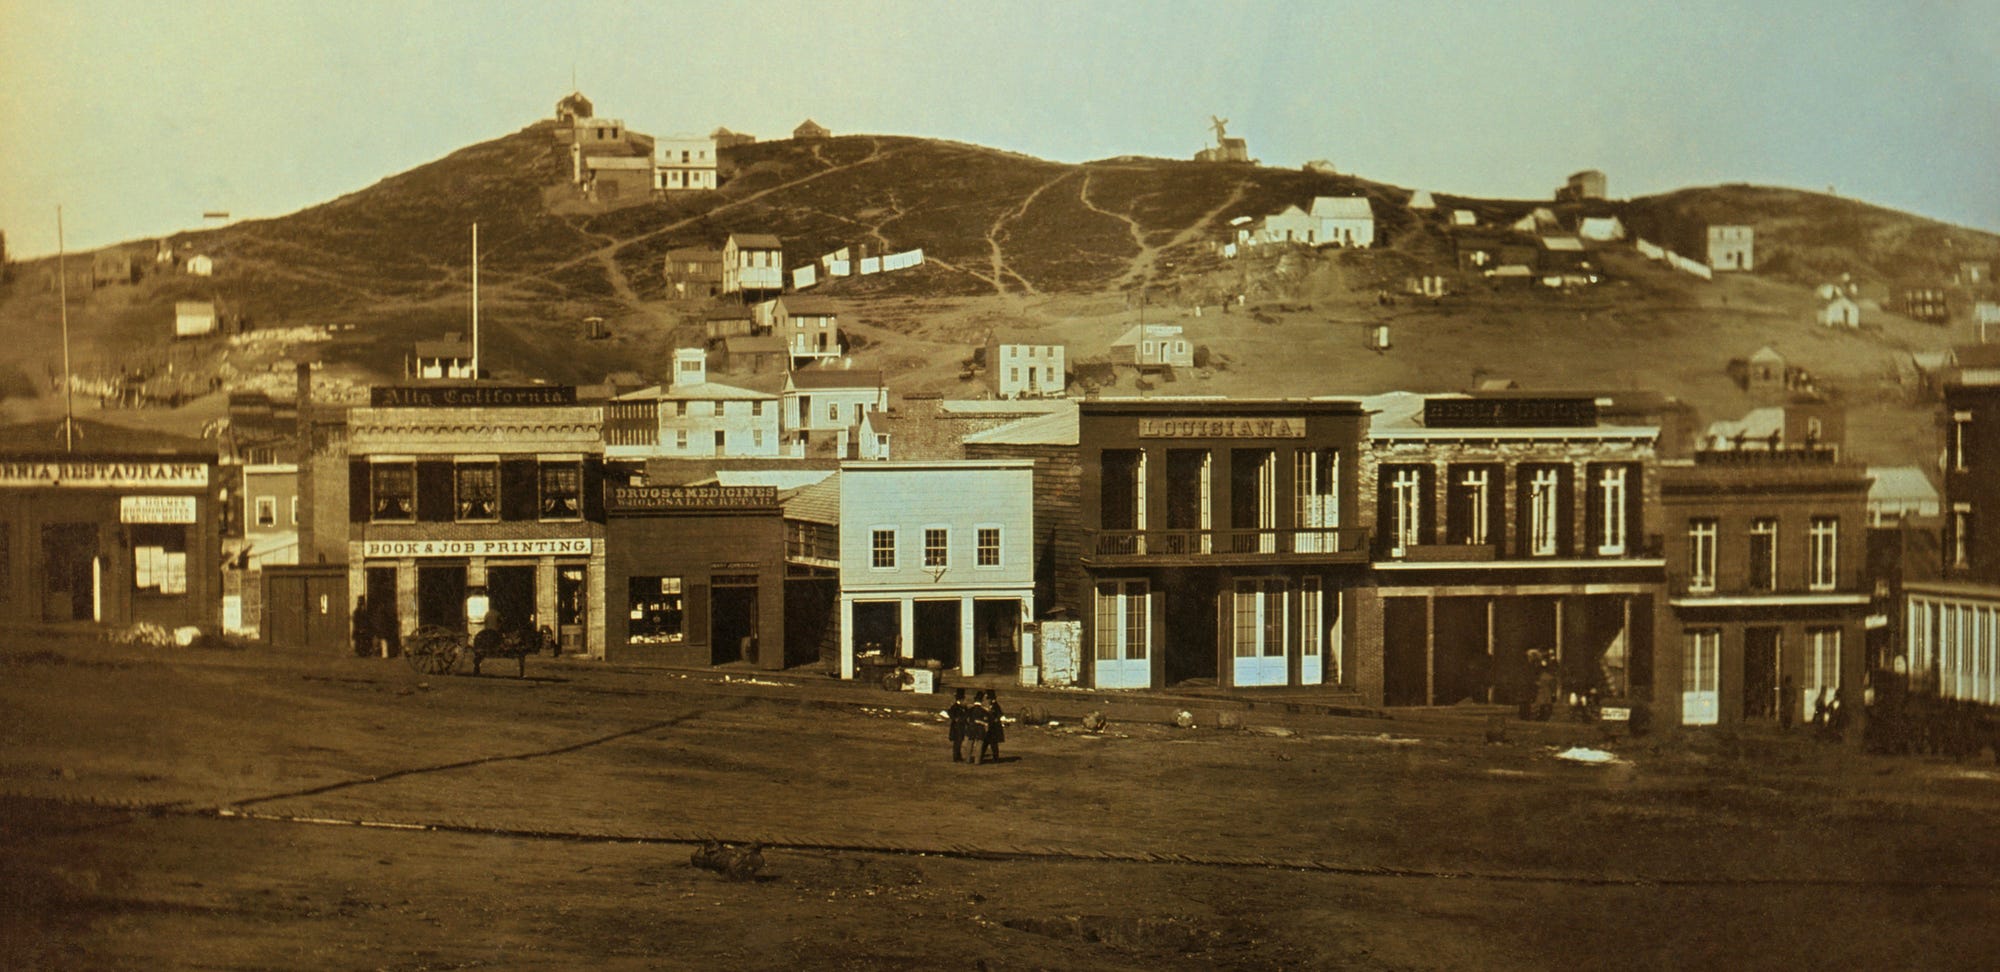
The United States claimed California in 1846, and prospectors discovered gold shortly thereafter in 1848. The accumulation of treasure-seekers set a small settlement on the path to becoming a metropolis, with San Francisco’s population exploding from about 500 in 1847 to over 20,000 just three years later.
The earlier populations of the Yerba Buena area were sparse and varied. Originally, the area was predominantly indigenous Ohlone people, then later settled by the Spanish, which drew a Hispanic population.
Sign up for The Bold Italic newsletter to get the best of the Bay Area in your inbox every week.
The population has skyrocketed to almost 900,000 people as of 2018 — and the demographic makeup of the city has shifted over time. This mesmerizing data visualization shows San Francisco’s demographics based on U.S. Census data since the Gold Rush. (Click the “play” icon in the lower left corner to start the animation.)
Charts: Ben Zotto
As you can see, the total population generally rockets upward constantly until the mid-1900s. For most of this period, the largest non-white group was Asian (Chinese and Japanese). That population grew and then shrank somewhat at the turn of the century, before growing again. Among other things, we can likely attribute that to the Chinese Exclusion Act. (There was also a small outbreak of bubonic plague in Chinatown.) The U.S. Census tracked these groups separately for a long time, then collapsed them into a general “Asian” category later in the 1900s. This animation sums the earlier groups into a coherent total.
During World War II, the African American population began to increase substantially for the first time here as part of the Second Great Migration, driven largely by men and families coming to the city to contribute to the war efforts. The shipyards at Hunter’s Point were a key employer.
Following the war, white flight hollowed out the city as people left for suburbia. The overall population started falling and didn’t bottom out until the early 1980s, only recovering from the 1950 peak in 2000. But that recovery was driven almost entirely by a rapidly rising Asian population (thanks largely to 1960s immigration policy changes).
The Black population peaked in 1970 and has fallen since. The white population growth stalled until it began rising again at the turn of the 21st century.
In recent decades, “Other” and “Two or more” have become materially sized groups in the Census. The latter grouping was tabulated for the first time in 2000.
The Hispanic or Latino population is not reflected in the chart above because the U.S. Census has treated it variously as a part of the white population, a distinct group, and an “ethnicity” overlay onto “race.”
Here’s another animated chart (starting in 1960 when data was available) showing this population change independently compared with all non-Hispanic/non-Latino people.
Admittedly this one is less exciting to watch, but it does show the steady rise across the decades, even against the backdrop of an overall population that is shrinking and then later expanding. The rate of growth appears to continue to rise in the most recent decade. This effect is visible and even greater in the rest of the Bay Area.
We’ll all know more once the 2020 Census data is available. Fill out your census forms here.
Read more like this:
The Bold Italic is a not-for-profit media organization, and we publish first-person perspectives about San Francisco and the Bay Area. We operate under a fiscal sponsorship of a 501(c)(3).
You can become a paid subscriber. Or donate. Or learn more about us.